
Figure 1.
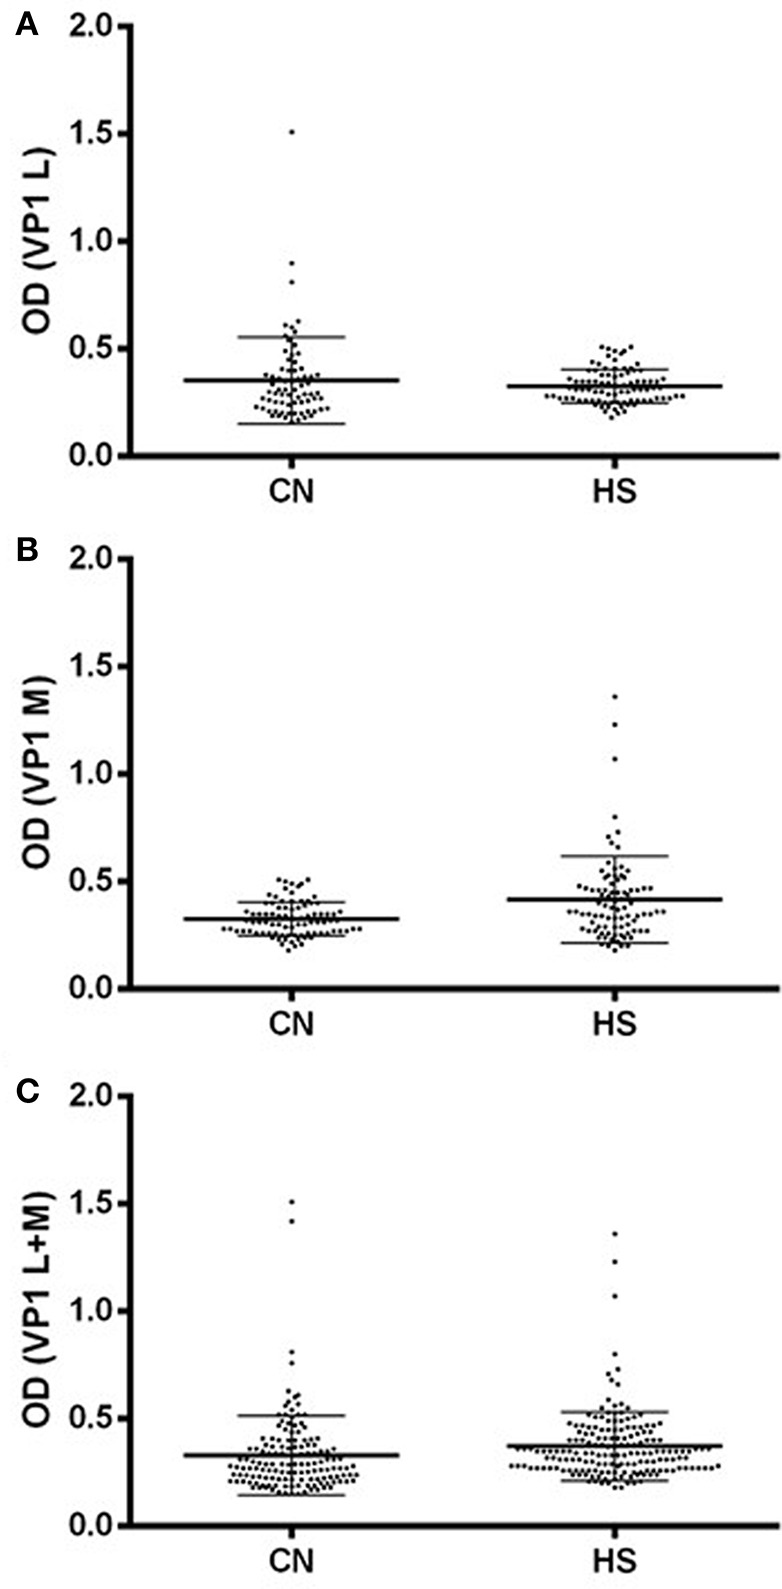
Serologic profile of serum antibody reactivity to BKPyV mimotopes VP1 L (A) and VP1 M (B) and VP1 L+M (C). Immunologic data are from CN and HS serum samples. Results are presented as values of optical density (OD) readings at λ 405 nm of serum samples diluted at 1:20, detected by the indirect enzyme-linked immunosorbent assay. In scatter dot plotting, each plot represents the dispersion of OD values to a mean level indicated by the line inside the scatter with SEM for each group of patients/subjects analyzed. (A) The mean OD for VP1 L in CN and HS does not differ statistically, while (B) the mean OD of sera (VP1 M ± Std Error) in CN (0.326 ± 0.008) is higher than that detected in HS (0.417 ± 0.021). (C) The mean OD of sera (VP1 B+C ± Std Error) in CN (0.329 ± 0.015) is lower than that detected in HS (0.372 ± 0.012). Statistical analyses were performed using t-test.