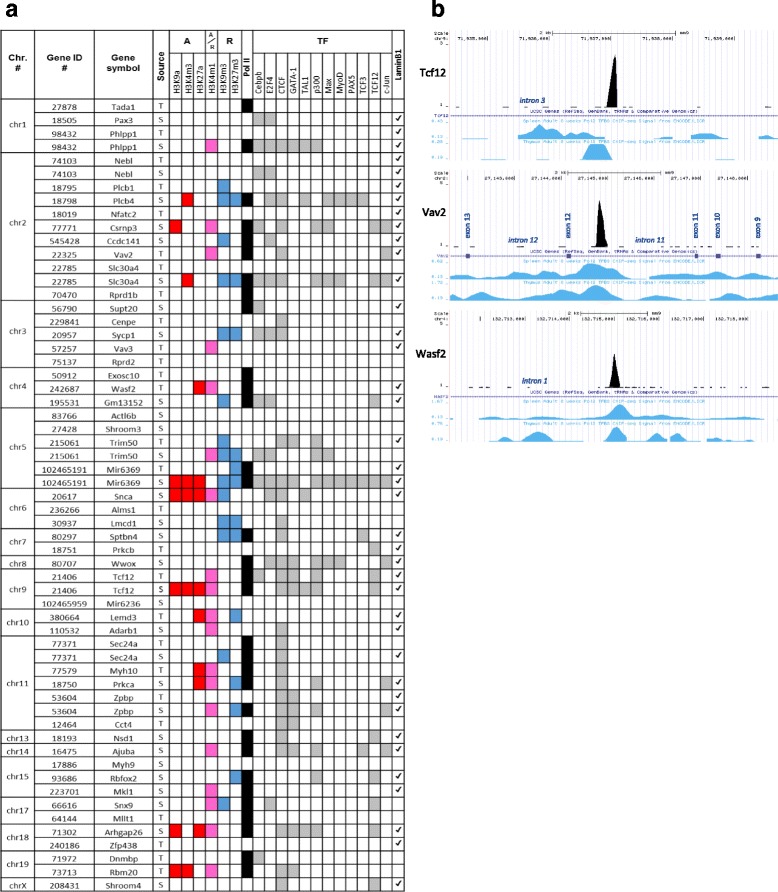
Fig. 2.

Transcription matrix for selected WASp enriched genes. a Bioinformatic association of WASp ChIP-seq peaks from our datasets with activating (A) and/or repressive (R) epigenetic regulatory marks, RNA Polymerase II and TFs peaks and lamin B1 marks in thymocytes (T) and spleen CD4+ cells (S). b Association of WASp ChIP-seq peaks in thymocytes of Tcf12, Vav2, and Wasf2 with RNA Polymerase II ChIP-Seq signal by TFBS ENCODE/LICR resource at UCSC genome browser
