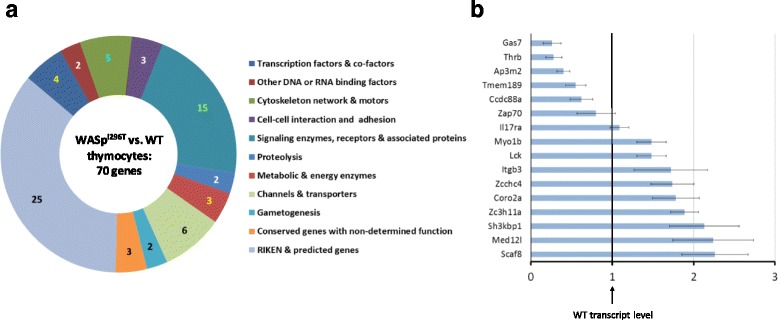
Fig. 5.

Gene regulation by nuclear WASpI296T. a Functional groups of peak-corresponding genes in WASp ChIP-seq refined datasets. b Gene expression profiling by RT-qPCR of WASpI296T ChIP-seq genes in WASpI296T vs. WT thymocytes. Expression in WASpI296Tthymocytes is shown and compared with expression in WT thymocytes set to 1. Gene expression profiling by RT-qPCR was performed in three biological replicates: WASpI296T n = 3 vs. WT n = 3 and in three technical replicates for each cDNA template sample with Ct variation between triplicates less than cut-off ± 0.25. Resulted gene expression data: the mean of the technical triplicate, ΔCt, RQ value, and standard deviation between RQ of biological triplicates is indicated. Additional file 3: sheet 3
