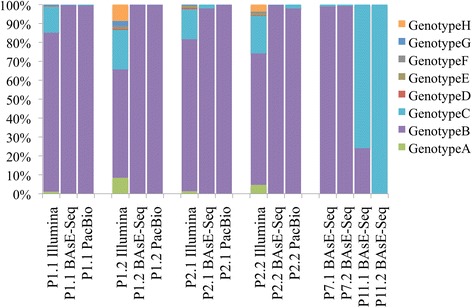
Fig. 2.

Genotype composition (Y-axis) of samples sequenced (X-axis) as reported by BWA-SW coverage across 8 reference genotype sequences. Samples are organized from left to right in order of P1.1, P1.2, P2.1, P2.2, P7.1, P7.2, P11.1, and P11.2, where P1.1 and P1.2 are two time points from the same patient P1, before and after drug resistance respectively. Wherever data from multiple technologies are available, order follows Pooled deep sequencing, BAsE-Seq, and lastly PacBio
