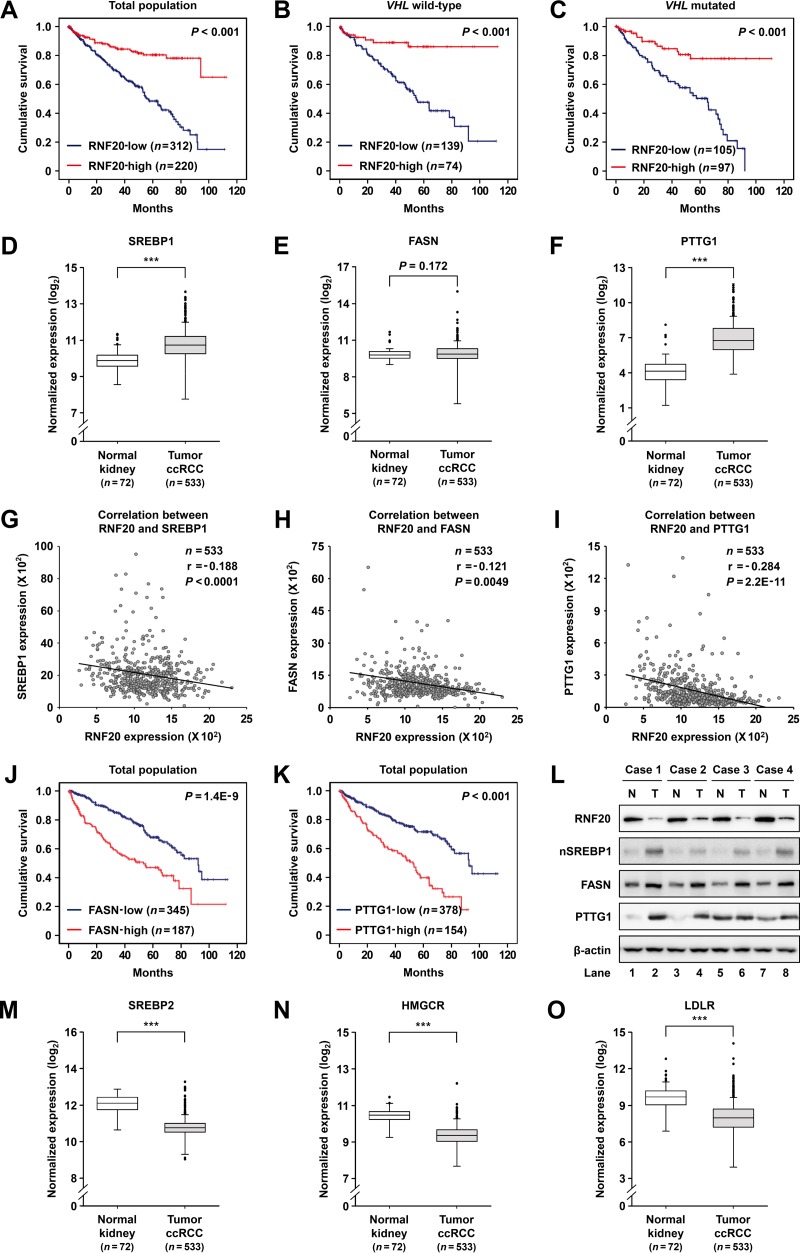
FIG 9.
SREBP1 activities are upregulated in ccRCC and are negatively correlated with RNF20 expression. (A) Kaplan-Meier survival curves of ccRCC patients enrolled in the TCGA database. Patients were divided into two groups according to median RNF20 mRNA levels, and differences were identified using the log rank test. (B and C) Survival stratified according to VHL mutation status. (D to F) Normalized RNA-seq reads of SREBP1 (D), FASN (E), and PTTG1 (F) in normal kidney and ccRCC tumor samples using the TCGA database. (G) Correlations between RNF20 and SREBP1 mRNA levels in ccRCC tumor samples identified from TCGA data sets using Pearson correlation tests. Numbers of cases (n), Pearson correlation coefficient (r), and P values are indicated. (H) Correlation of RNF20 and FASN mRNA expression in ccRCC samples identified by Pearson correlation tests. (I) Correlation of RNF20 and PTTG1 mRNA expression in ccRCC samples identified by Pearson correlation tests. (J) Kaplan-Meier survival analysis for ccRCC patients from low or high FASN expression groups. P values were calculated by the log rank test. (K) Kaplan-Meier survival analyses of ccRCC patients in low and high PTTG1 expression groups. (L) Protein levels in patient-matched normal kidney (n = 4) and ccRCC tumor (n = 4) samples were determined by Western blotting. N, normal kidney; T, ccRCC tumor; nSREBP1, nuclear SREBP1. (M to O) Normalized RNA-seq reads of SREBP2 (M), HMGCR (N), and LDLR (O) in normal kidney and ccRCC tumor samples using the TCGA database.

