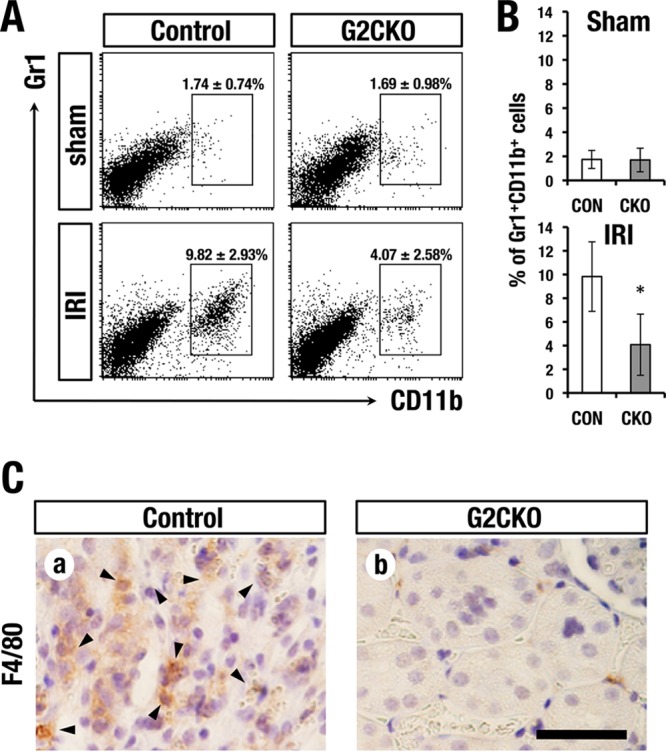
FIG 3.

Lower counts of infiltrating inflammatory cells in G2CKO kidney after IRI. (A) Flow cytometry analysis of Gr1+ CD11b+ infiltrating inflammatory cells in the kidney 2 days after IRI. (B) Quantification of infiltrating inflammatory cells in G2CKO and control (Con) mouse kidneys. The data are presented as means ± SD (n = 3 for each group). Statistical significance of differences is indicated (*, P < 0.05). (C) Immunohistochemistry using anti-F4/80 antibody 2 days after renal IRI. Note that the control mouse kidney showed robust infiltration of F4/80-positive macrophages (arrowheads), while the G2CKO kidney showed lower levels of macrophage infiltration than the control mouse (scale bar, 100 μm).
