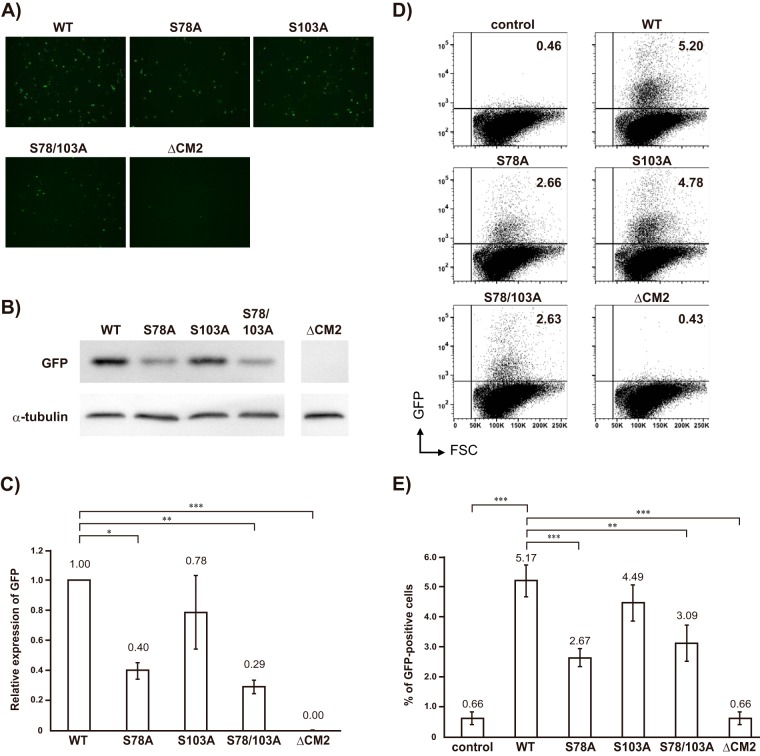
FIG 3.
Reporter gene expression in HMV-II cells infected with VLPs. (A) HMV-II cells were infected with equal amounts of WT-VLPs, VLPs containing CM2-S78A, CM2-S103A, or CM2-S78/103A, and ΔCM2-VLPs, based on the amounts of GFP-vRNA, superinfected with the helper virus, and then incubated for 48 h. The representative microscopic data from four independent experiments are shown. (B) The cells in the experiment shown in panel A were lysed and analyzed by Western blotting using anti-GFP polyclonal antibodies. The representative data for three independent experiments are shown. α-Tubulin, as an internal control, is shown in the lower panel. (C) The three independent Western blotting experiments shown in Fig. 3B were next analyzed by densitometry, followed by statistical analysis. The amount of GFP proteins expressed in the cells infected with WT-VLPs was used for normalization. All data are presented as the ratio of means ± SEM unless otherwise indicated. For comparisons between all possible pairs in each experiment group, analysis of variance (ANOVA) with Tukey's post hoc test was used, with a P value of <0.05 considered to be statistically significant (*, P < 0.05; **, P < 0.01; ***, P < 0.001). (D) HMV-II cells were mock infected (control) or infected with equal amounts of WT-VLPs, VLPs containing CM2-S78A, CM2-S103A, or CM2-S78/103A, and ΔCM2-VLPs, superinfected with the helper virus, and then incubated for 48 h, followed by flow cytometry. Representative data for three independent experiments are shown. Vertical and horizontal lines indicate GFP intensities and forward scattered light (FSC) corresponding to the size of cells, respectively. Each dot indicates an individual cell. Upper right and lower right squares represent GFP-positive and GFP-negative cells, respectively. Numbers shown at the upper right of each panel indicate the rate (percentage) of the GFP-positive cells per total number of cells. (E) The three independent flow cytometry experiments were analyzed statistically as described in for panel C. Analysis of variance (ANOVA) with Tukey's post hoc test was used, with a P value of <0.05 considered to be statistically significant (*, P < 0.05; **, P < 0.01; ***, P < 0.001).

