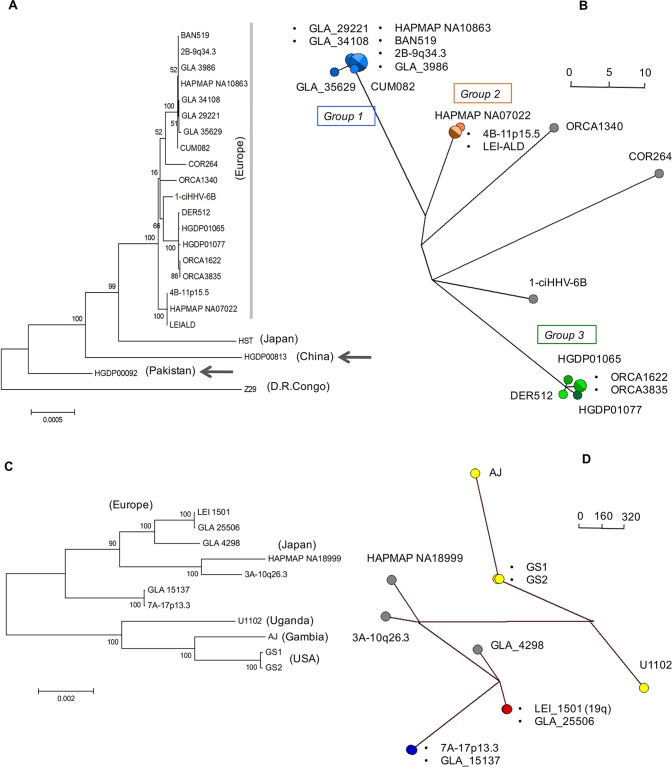
FIG 3.
Phylogenetic analysis of ciHHV-6 and reference nonintegrated HHV-6 genomes. (A) Maximum-likelihood phylogenetic tree of 21 ciHHV-6B genomes and two HHV-6B reference genomes (strains HST [Japan] and Z29 [Democratic Republic of the Congo]). A total of 130,412 nucleotides were analyzed, excluding repeat regions and missing amplicons. The scale bar represents 0.0005 substitutions per site. (B) Phylogenetic network generated from the data set used in panel A, but without the HST and Z29 genomes and the ciHHV-6B genomes from HGDP00813 (China) and HGDP00092 (Pakistan). The ciHHV-6B genomes from Europeans in groups 1, 2, and 3 are shown as blue, orange, and green dots, respectively, and the singletons are shown as gray dots. (C) Maximum-likelihood phylogenetic tree of seven ciHHV-6A genomes and four HHV-6A reference genomes (strains U1102 [Uganda], AJ [Gambia], and GS1 and GS2 [United States]; GS1 and GS2 are two versions of strain GS). A total of 117,900 nucleotides were analyzed, excluding repeat regions and missing amplicons. The scale bar represents 0.002 substitutions per site. (D) Phylogenetic network generated from the data set used in panel C. The nonintegrated HHV-6A reference genomes are shown as yellow dots. The closely related ciHHV-6A genomes are shown as pairs of red or blue dots and singletons as gray dots (including one from Japan). The scale bars in the networks (C and D) show the number of base substitutions for a given line length. The dots are scaled, with the smallest dot representing a single individual.

