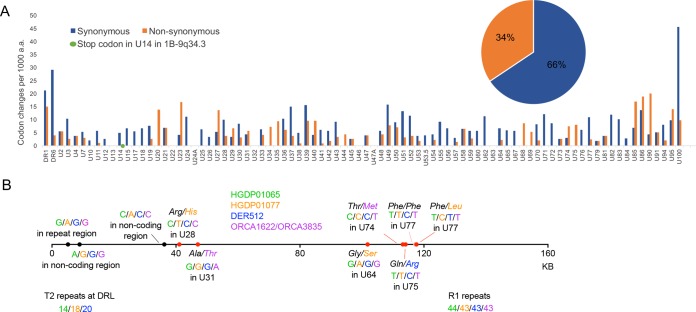
FIG 7.
Consequences of nucleotide substitutions across the ciHHV-6 genome. (A) Comparison of synonymous (blue) and nonsynonymous (orange) substitution frequencies in each ciHHV-6B gene among the 21 ciHHV-6B genomes (scaled to differences per 1,000 amino acids). The green dot shows the novel in-frame stop codon in U14 of 1-ciHHV-6B. The pie chart shows the overall proportions of synonymous and nonsynonymous substitutions across all the genes. (B) Diagram showing the approximate locations and consequences of nucleotide substitutions that are predicted to have arisen after integration in group 3 ciHHV-6B genomes. The horizontal line represents the HHV-6B genome; black dots, locations of noncoding base substitutions; red dots, base substitutions within HHV-6B genes that are predicted to result in amino acid substitutions (nonsynonymous), as indicated; pink dot, synonymous (T-to-C) substitution in DER512 that is not predicted to change the phenylalanine. The numbers of repeats in three regions (T2, R1, and R4) that vary among the group 3 genomes are also shown.

