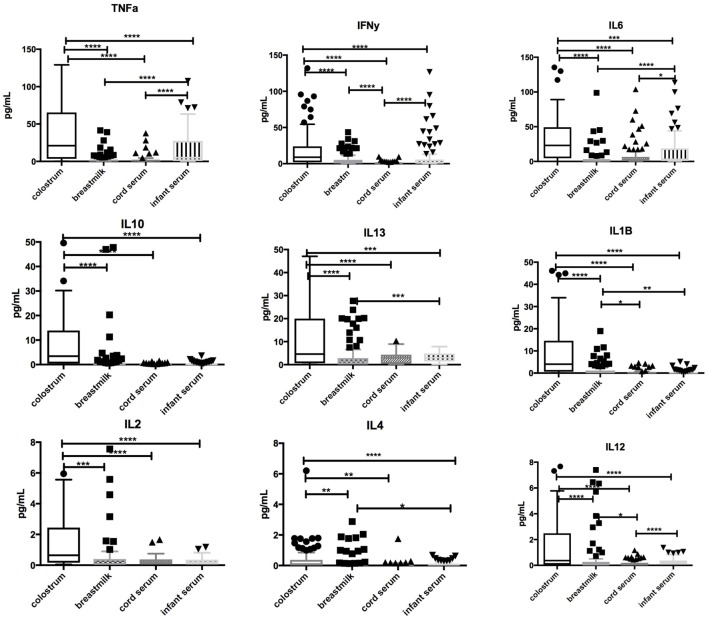
Figure 2.
Comparison of cytokine concentrations in colostrum, breastmilk, cord blood, and infant serum. Box-and-whisker plot of concentrations of TNFα, IFN-γ, IL-1β, IL-2, IL-4, IL-6, IL-10, IL-12, and IL-13 in colostrum, breastmilk, cord, and infant serum in picograms per milliliter (pg/mL). 100 samples were assessed. Median and interquartile range is demonstrated. Solid shapes indicate outliers. *p = <0.05, **p < 0.01, ***p < 0.001, ****p < 0.0001.

