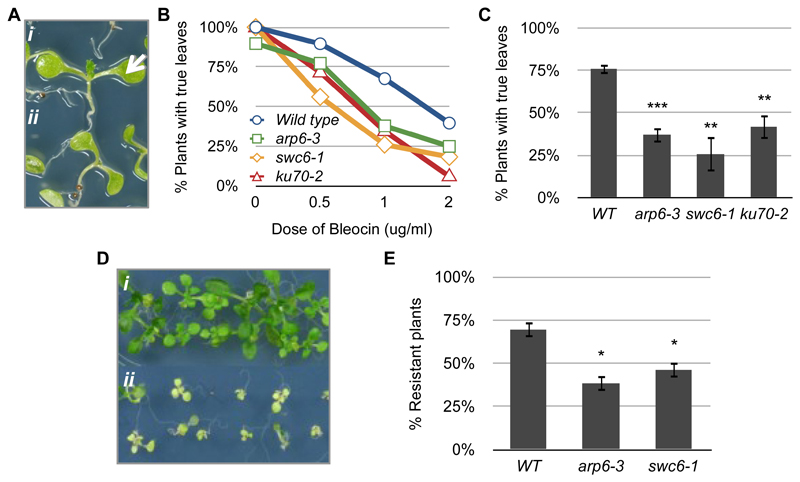
Figure 1. Examples of results.
(A) Phenotypes of 10-day-old bleocin-treated seedlings with (i, arrow) and without (ii) true leaves. (B) True leaf assay showing the response of wild type, arp6-3, swc6-1 and ku70-2 to different doses of bleocin. Each plotted value corresponds to the scoring of one experiment with 60-80 seedlings. (C) True leaf assay with seedlings treated with 1 μg/ml of bleocin. The percentage of 10-d-old treated plants with true leaves was calculated in relation to mock samples. Bars depict the averages between 3 to 5 experiments with 75 to 100 seedlings per treatment. (D) Phenotypes of 12-day-old UV-C-treated resistant (i) and sensitive (ii) seedlings. (E) UV resistance assay of seedlings treated with 3 kJ/m2 of UV-C. Bars depict the averages between 4 experiments with 75 to 100 seedlings per treatment. Asterisks indicate the significance between treated and non-treated samples according to P values from unpaired t tests: ***P < 0.001 and **0.001 < P < 0.01.

