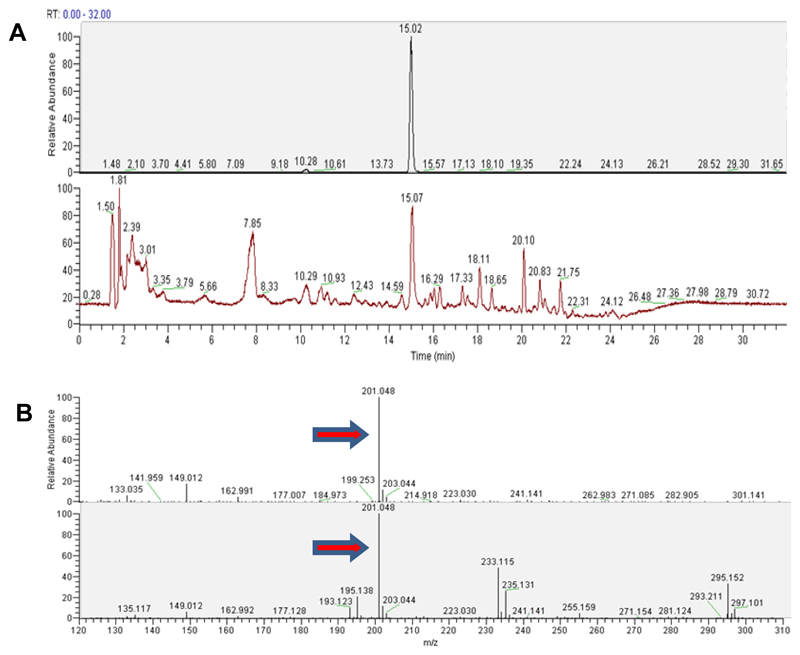
Figure 2. LC-MS analyisis of camalexin from external standard (upper panels) and from the plant tissue (lower panels).
A. Total ion chromatograms (TICs). B. ESI mass spectra in positive ionization mode. The mass of 201.048 corresponds to C11H9N2S, the protonated form of camalexin [M+H]+ (red arrows).

