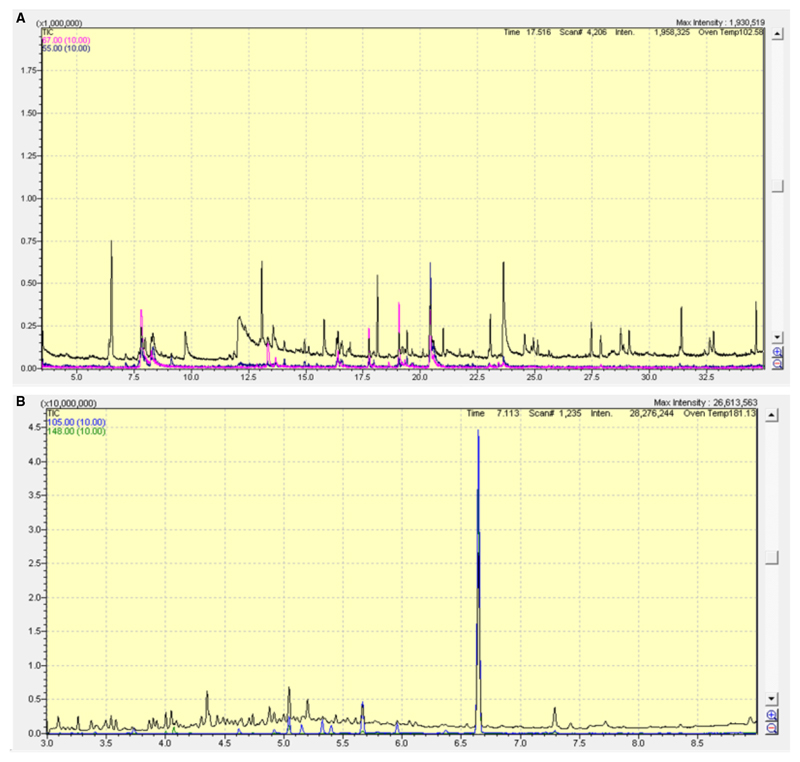
Figure 4. Example chromatograms of a headspace volatile collection from a N. attenuata leaf A and a flower B.
The total ion chromatogram (TIC) and representative ion traces (A. m/z 55 and 67 to represent green leaf volatiles; B. m/z 105 and 148 to represent benzyl acetone) are shown. Peak identities can be found in Kallenbach et al. (2014).

