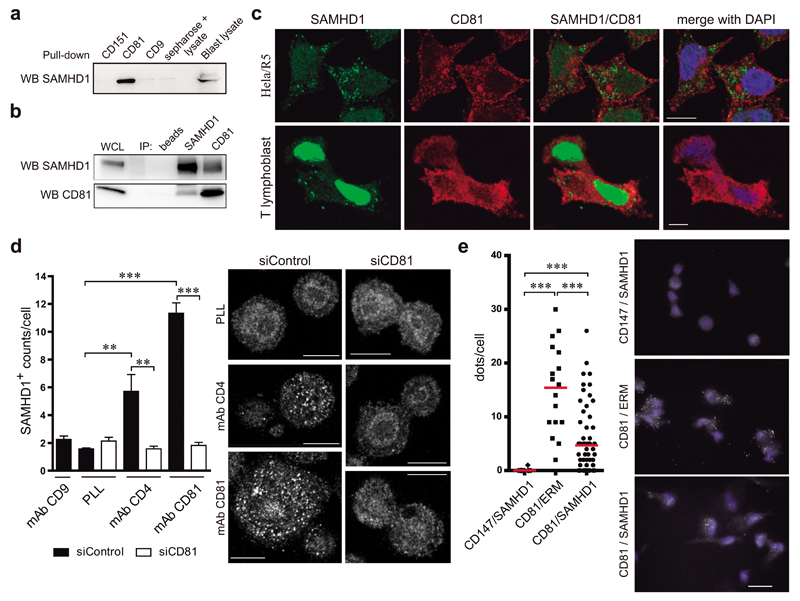
Figure 1. The C-terminal domain of CD81 mediates its association with SAMHD1.
a) SAMHD1 immunoblot of primary T lymphoblast lysates pulled-down with biotinylated peptides of tetraspanins CD81, CD9 and CD151 C-terminal domains. Sepharose-negative control and whole cell lysate are shown. b) Primary T lymphoblast lysates were immunoprecipitated and immunoblotted with SAMHD1 or CD81 antibodies. Control beads incubated with cell lysate, and whole cell lysate are shown. c) Hela/R5 cells or primary T lymphoblasts were plated onto PLL, fixed, permeabilized in PBS 0.5% Triton X-100 for 5 min, stained for CD81 (red) and SAMHD1 (green), and analysed by confocal microscopy. One single confocal plane is shown, nuclei are in blue. Bar = 10μm. d) Hela/R5 cells transfected with control siRNA (siControl) or CD81 siRNA (siCD81) were plated onto PLL (10μg/ml), anti-CD9 (VJ1/20, 10μg/ml), anti-CD4 (HP2/6, 10μg/ml) or anti-CD81 (5A6, 10μg/ml) monoclonal antibodies for 2h, fixed, permeabilized in 0.5% Triton X-100 for 5min, and stained for SAMHD1 (polyclonal antibody). Images show a single confocal plane at a ventral position, bar = 10μm. Graph shows means ± SEM of the number (counts/cell) of SAMHD1+ clusters (n=50 cells, 3 independent experiments), analysed by one-way ANOVA with Tukey’s post-test. e) Duo-link immunoassay of primary T lymphoblasts plated onto PLL, permeabilized in PBS 0.5% Triton X-100 for 5min, and stained for SAMHD1 and CD81. SAMHD1/CD147 and CD81/ERM were used as negative and positive controls respectively, bar = 10μm. Graph shows the number of dots per cell; each dot represents a single cell, bars denote the mean of scatter plots, and data was analysed by one-way ANOVA with Dunns post-test.

