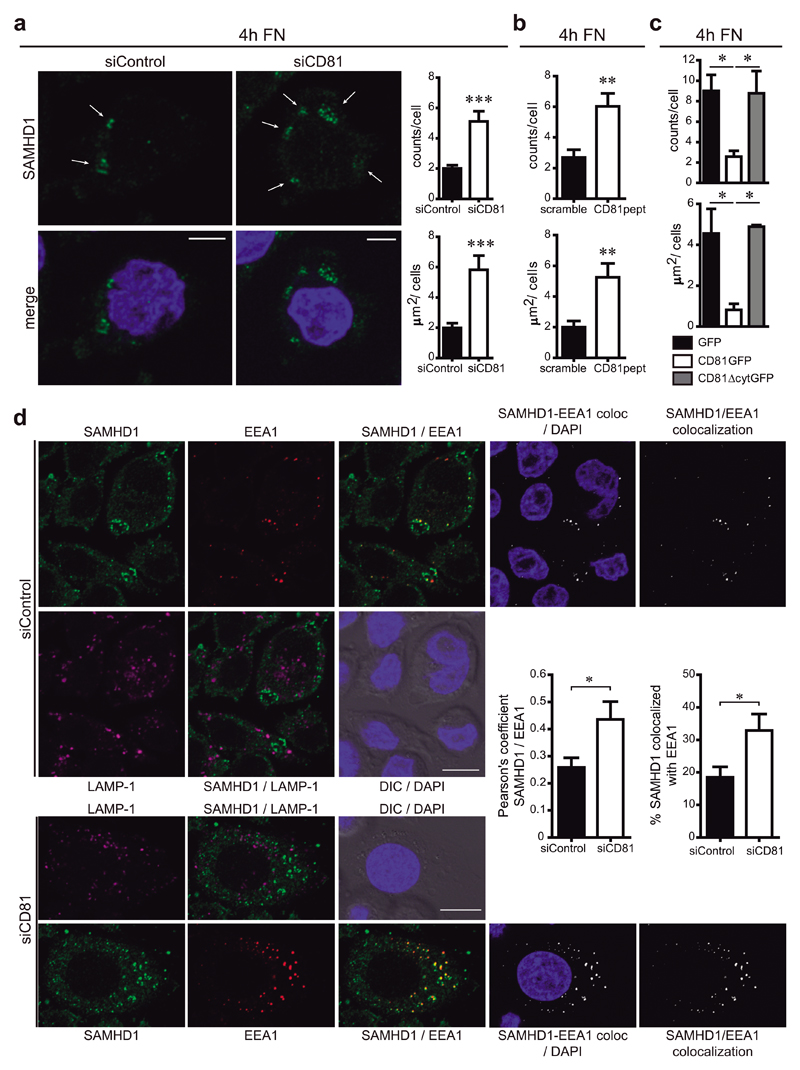
Figure 6. SAMHD1 is partially enriched at early endosomes.
a) Hela/R5 cells were transfected with control or CD81 siRNA, adhered for 4h onto fibronectin (FN), fixed, permeabilized in PBS 0.1% Triton X-100 for 5min, and immunolabelled for SAMHD1. Images show one single confocal plane, nuclei are in blue. Arrows indicate SAMHD1 accumulation in circular-shaped intracellular structures, bars = 10μm. Graphs show means ± SEM of the number (counts/cell) and area (μm2/cell) of the cytoplasmic structures observed (n=230 cells, 4 independent experiments analysed by Student t-test, *** p = 0.0005 (upper) and *** p = 0.0006 (bottom)). b) Hela/R5 cells treated with 2μM of scramble or CD81pept were analysed as in a (n=400 cells, 4 independent experiments analysed by Student t-test, ** p = 0.0063 (upper) and ** p = 0.0054 (bottom)). c) Hela/R5 cells transfected with GFP, CD81GFP or CD81∆cytGFP were analysed as in a (n=20 cells, 2 independent experiments analysed by one-way ANOVA with Tukey’s post-test). d) Hela/R5 transfected with control or CD81 siRNA were treated as in a. Images show SAMHD1 (green), EEA1 (red), LAMP-1 (magenta), nuclei (blue), DIC, SAMHD1/EEA1 co-localization channel (white), and merged images. One single confocal plane is shown, bars = 10μm. Graphs represent the quantification of SAMHD1-EEA1 co-localization performed in 3D stack confocal microscopy images, showing means ± SEM of the Pearson’s coefficient; and of the % of SAMHD1 signal co-localized with EEA1 signal with respect to the total SAMHD1 signal in the cell (n = 200 cells, 3 independent experiments analysed by Student t-test, * p = 0.0262 (left) and * p = 0.0479 (right)).

