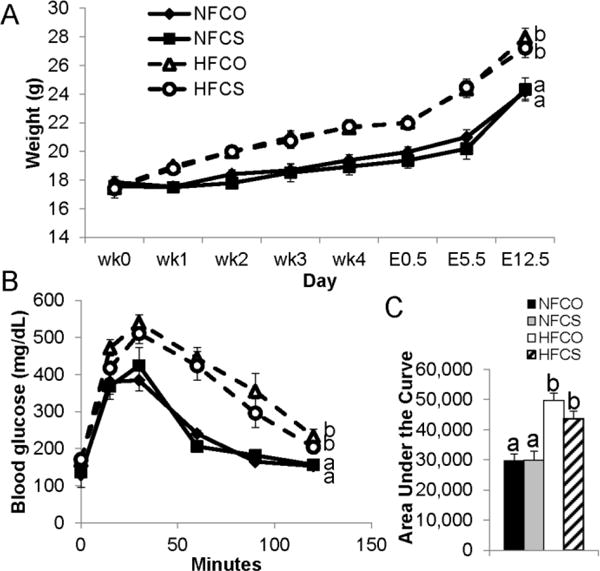
Fig. 1.

Weight gain and intraperitoneal glucose tolerance (IGT) of dams fed different diets. (A) Weight gain was measured both before timed-mating and during gestation (E0.5–E12.5). (B) IGT tests were conducted at E11.5 with 2g/kg D-glucose injected. (C) The area under the curve of the IGT tests. NFCO: n = 8; NFCS: n = 6; HFCO: n = 8; HFCS: n = 7. Values are mean ± standard error of mean (SEM); different letters indicate P < 0.05. NF: normal-fat diet; HF: high-fat diet; CO: control; CS: choline supplemented.
