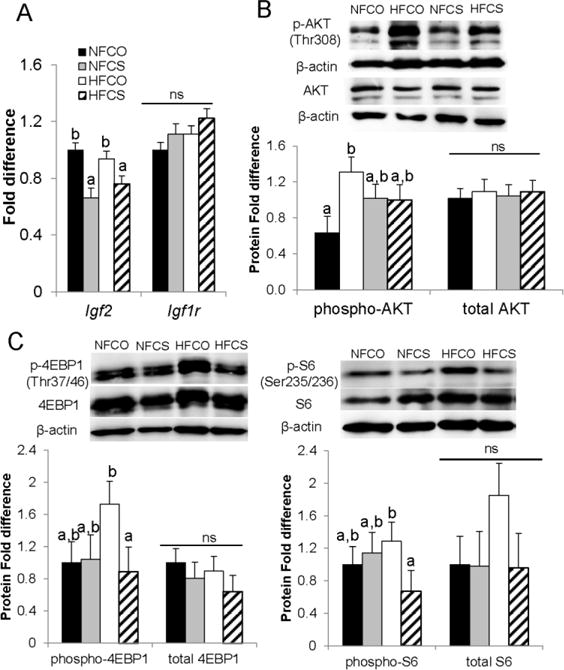
Fig. 5.

mRNA abundance of the IGF system and activation of the AKT/mTOR pathway in the placenta at E12.5. Different diets were fed to dams from 4 weeks before timed-mating to gestational day 12.5. (A) mRNA abundance was measured by real-time PCR. (B) AKT phosphorylation and (C) mTOR-regulated proteins were assessed by western blot. Solid bars, NFCO, n = 8; shaded bars, NFCS, n = 6; open bars, HFCO, n = 7; hatched bars, HFCS, n = 6. n is the number of dams. Two placentas in each dam were included in the analysis. Values are mean ± standard error of mean (SEM); different letters indicate P < 0.05; ns: not significant. AKT: protein kinase B; IGF, insulin-like growth factor; Igf1r, insulin-like growth factor 1 receptor; mTOR, mechanistic target of rapamycin; S6, ribosomal protein S6; 4E-BP1, 4E-binding protein 1. NF: normal-fat diet; HF: high-fat diet; CO: control; CS: choline supplemented.
