Figure 3.
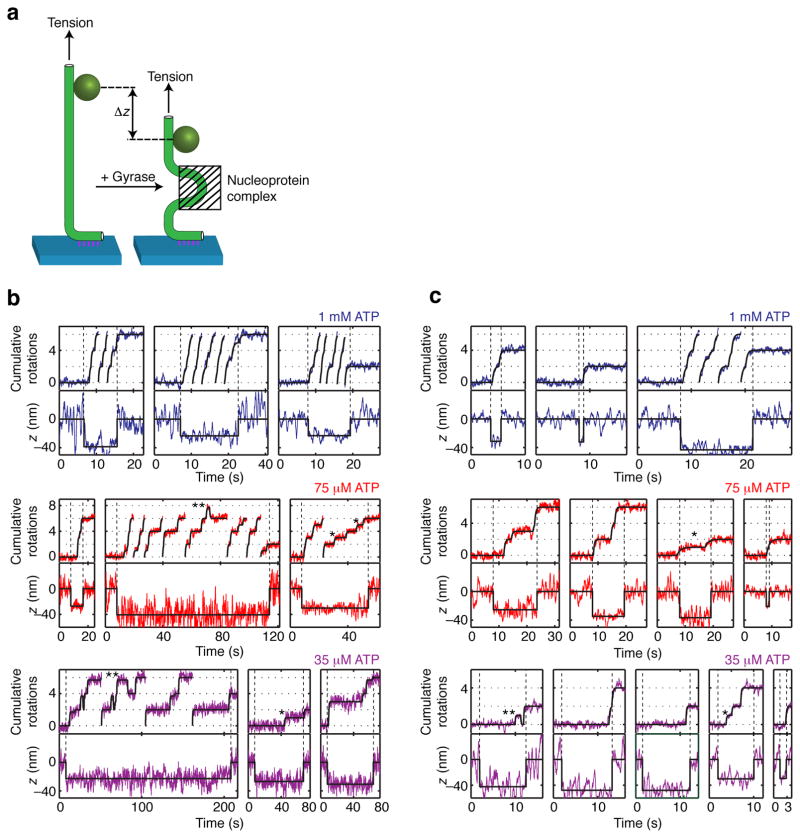
Simultaneous measurements of DNA rotation and contraction. (a) Changes in z reflect changes in overall DNA extension due to formation or rearrangement of a nucleoprotein complex. Simultaneous measurements of angle and z taken under (b) 0.5 pN or (c) 1 pN tension show that the DNA extension becomes contracted upon gyrase binding and remains contracted throughout processive bursts of activity. Traces that reach the top of the angle axis are continued from the bottom of the axis. Solid black lines show stepwise fits (see Methods). Contraction persists during the dominant [ATP]-dependent pause at 0 rotations as well as during secondary pauses at ~1 rotation (examples marked with *) and reversible excursions to ~1.7 rotations (examples marked with **). Contraction precedes angular rotation at the start of processive bursts, as indicated by the vertical dashed lines.

