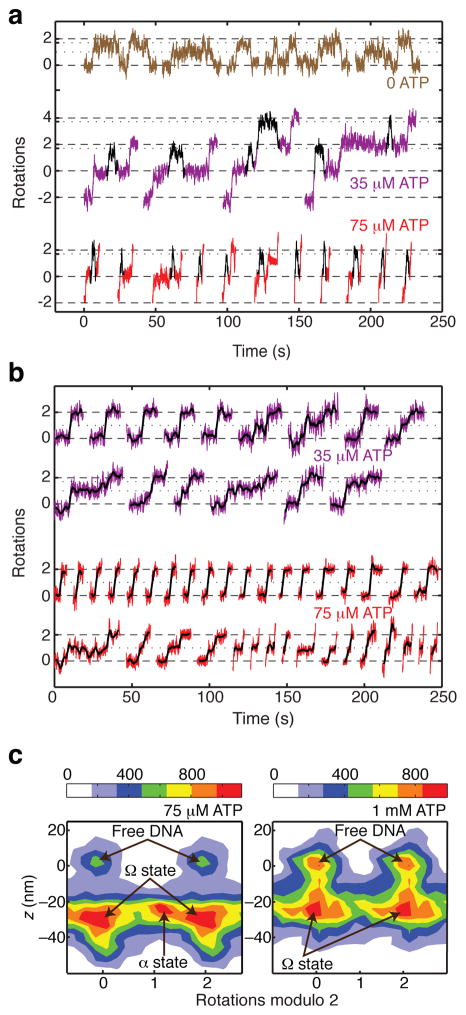
Figure 5.
[ATP]-dependent dwells in supercoil-trapping intermediates. (a) Excised regions of rotor traces showing reversible excursions to ~1.7 rotations at 35 and 75 μM ATP. Excursions are highlighted in black. The duration of excursions is reduced at higher [ATP]. (b) Excised steps from rotor traces, showing midcyle pauses at low [ATP]. Raw data are overlaid with averaged traces (2 s rolling window). Examples of steps are shown with either no detectable pause, a midcycle pause at ~1 rotation, or a midcycle pause at ~1.7 rotations. Pauses at ~1.7 rotations are rarely long enough to be discriminated from the subsequent plateau at our spatiotemporal resolution. (c) Two-dimensional histograms of paired (angle, z) data, taken from processive runs at 0.5 pN tension (comprising a total of 261 steps at 1 mM ATP and 118 steps at 75 uM ATP) together with flanking regions of inactivity (800 frames on either side of each event at 1 mM ATP, and 1500 frames on either side of each event at 75 μM ATP). At both ATP concentrations, populations can be distinguished corresponding to enzyme-free DNA and the contracted Ω state. At low [ATP], an additional population can be distinguished intermediate between 0 and 2 rotations, as expected for midcycle α states that trap positive supercoils. The mean contraction observed for a given event was 27 ± 2 nm (mean ± SEM) at 1 mM ATP, and 30 ± 2 nm (mean ± SEM) at 75 μM ATP. The legend shows the correspondence between color coding and histogram counts, where each count represents a data point from a 4 ms frame.

