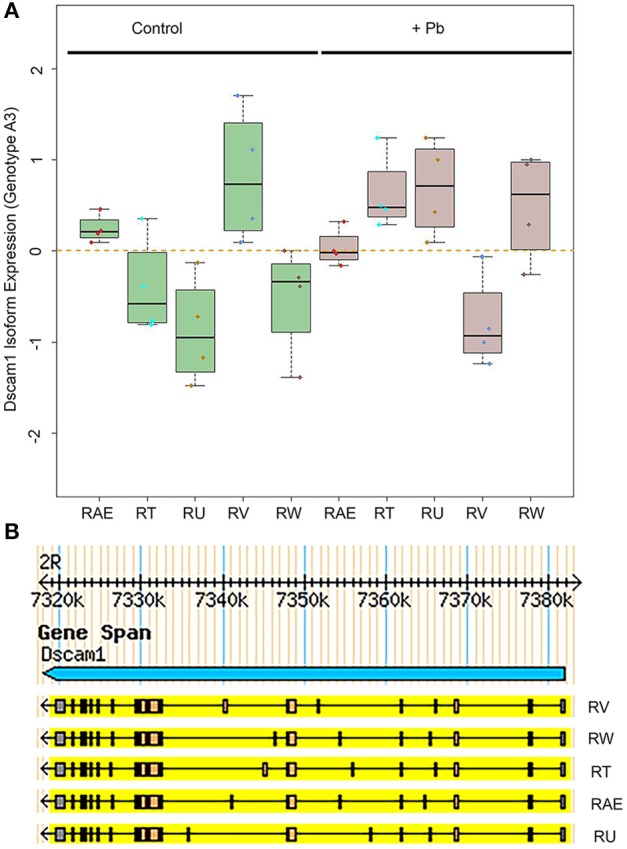
Figure 5.

Differential Dscam1 isoform expression upon lead exposure. (A) Green boxes represent control samples and gray boxes represent Pb-treated samples. The RefSeq names of the significantly different alternative transcripts are shown on the X axis. (B) UCSD Genome Browser version of 5 isoforms of Dscam1 whose levels are significantly altered by Pb.
