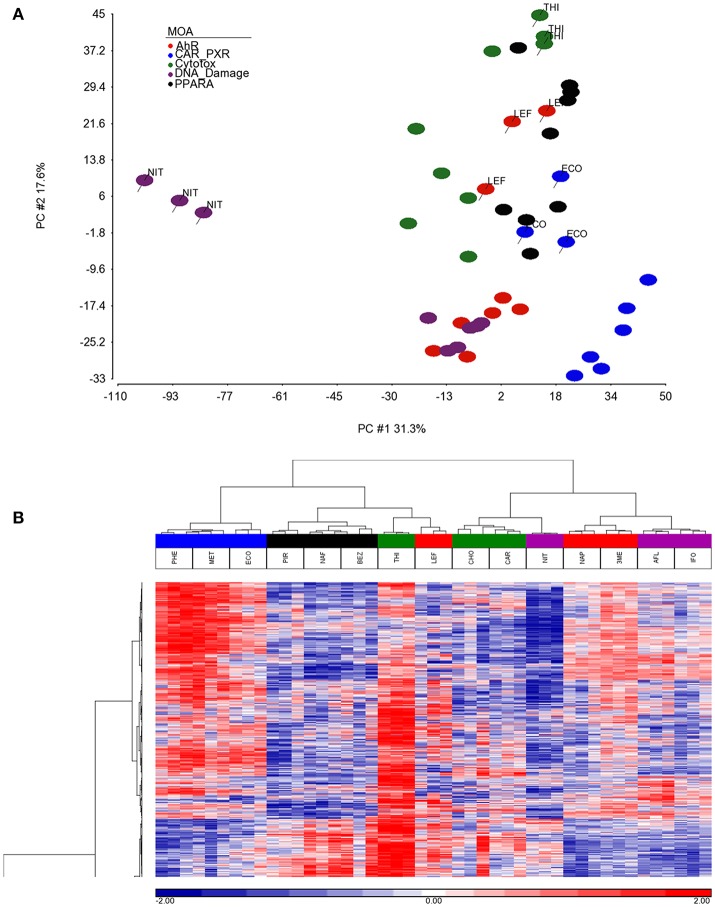
Figure 2.
Separation and clustering of samples exposed to the chemicals in triplicate. (A) Principal component analysis (PCA) separation of the MOA samples using the 2,930 significant gene probe sets that vary by MOA. The x-axis is PC#1 (31.3% variation captured), the y-axis is PC#2 (17.6% variation captured) and the colors represent the MOAs as shown in the figure legend. (B) Two-dimensional hierarchical, agglomerative clustering of the MOA samples using the 2,930 significant gene probe sets that vary by MOA. Clustering performed using Spearman rank as the similarity metric and the Ward minimum variance criterion for grouping. The x-axis is the MOA samples colored as described in the legend to (A), the y-axis is the 2,930 significant gene probe sets. The data is the log base 2 ratio (treated sample to the average of the controls matched according to nutritional status of the vehicle and route of administration) and the scale on the bottom displays the color range for the log base 2 ratio values standardized to mean 0 and standard deviation of 1. Red denotes up-regulation, blue down-regulation, and white relatively no change.

