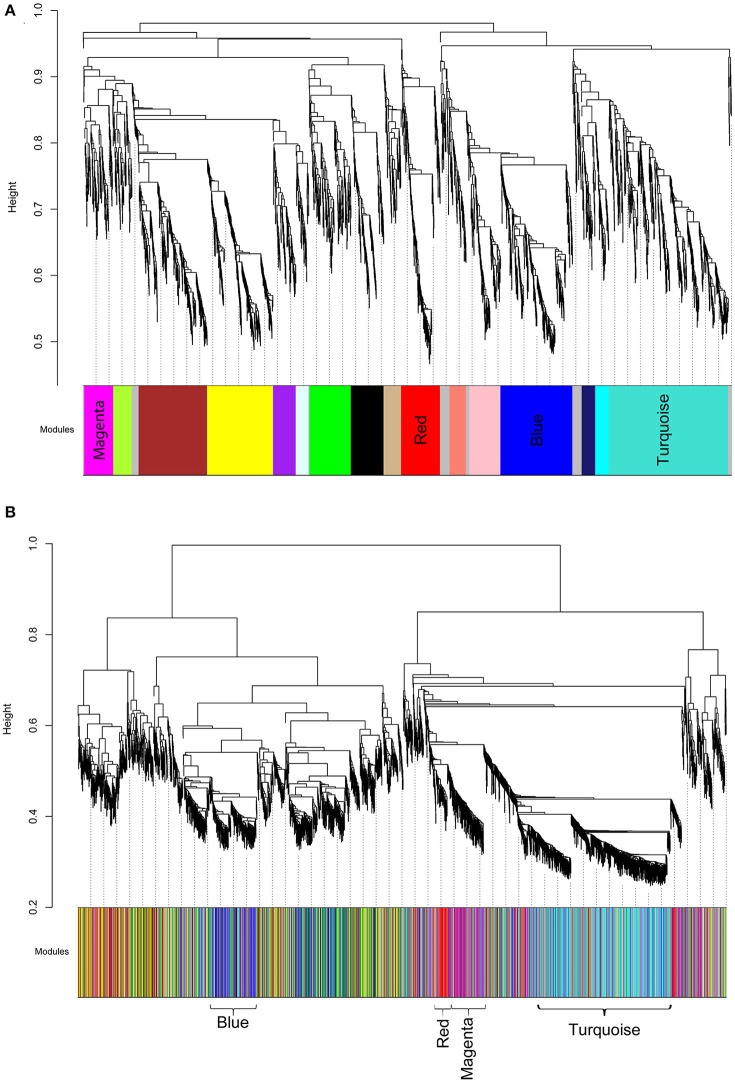
Figure 4.
Cluster dendrograms and modules representative of gene co-expression networks. (A) RM cluster dendrogram. (B) NRM cluster dendrogram. The x-axes represent the modules identified relative to the RM clustering. The colors indicate the preserved modules. The significantly preserved modules are labeled by color. The y-axes show the heights where clusters are merged.

