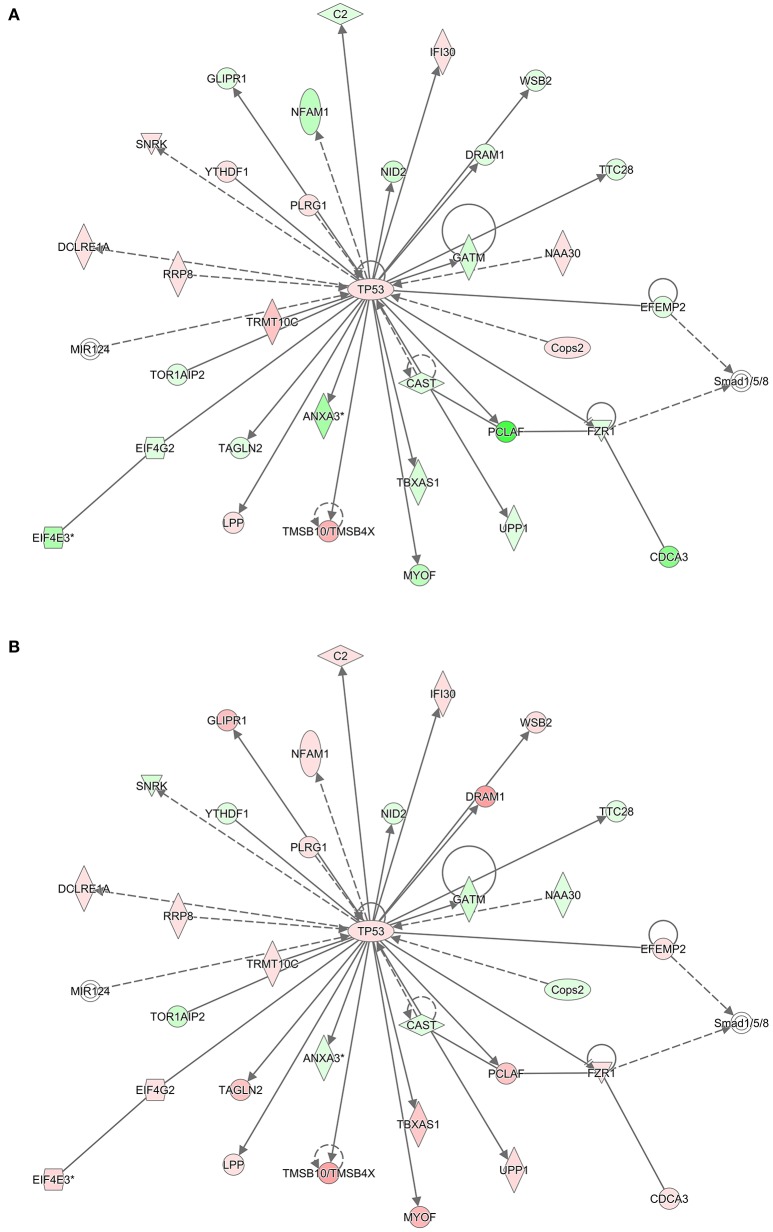
Figure 5.
TP53 Interaction network. Using the 540 gene probe sets (462 genes) from the most significant module (Turquoise) preserved between (A) RM and (B) NRM samples that were mapped to pathways in the Ingenuity Pathway Analysis knowledgebase, molecular networks were generated. Shown is the most significant interaction network with TP53 as the central hub. Colored nodes represent 33 genes (or their products) that are part of the 540 gene probe sets. The gene expression values are the log base 2 ratio from the average of the triplicates for each chemical treatment to the average of the controls matched according to nutritional status of the vehicle and route of administration, averaged by MOA and according to either RM or NRM. Red represents increased expression and green represents decreased expression. Shape representations: circles, protein-coding genes; diamonds, enzymes; squares, cytokines; horizontal ovals, transcription regulators; vertical ovals, transmembrane receptors. A solid line represents a direct interaction, whereas a dashed line represents an indirect interaction. A line with an arrow denotes activation, whereas a line with an arrow and a pipe (|) denotes acts on and inhibits, respectively. A line without an arrow or pipe (|) denotes a protein–protein interaction.

