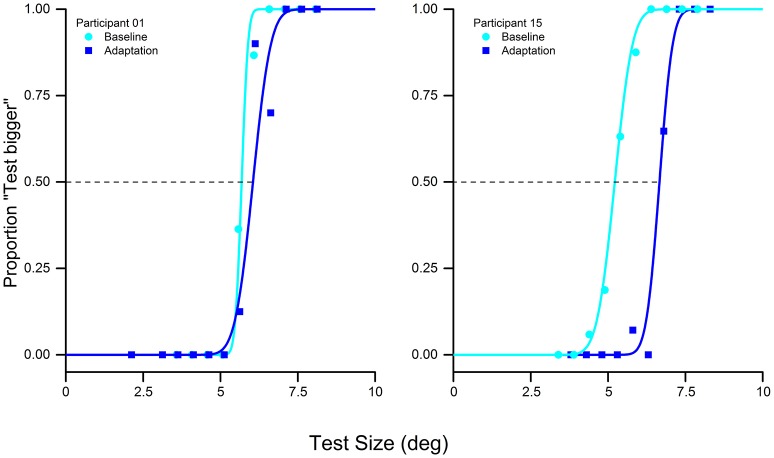
Figure 2.
Psychometric discrimination function of the baseline (cyan) and adaptation (blue) in the visual-only condition of two typical subjects: adaptation to a 10° stimulus with a reference of 5° produces a rightward shift of the psychometric curve, indicating that the adaptation reduces the perceived size of the test stimulus.

