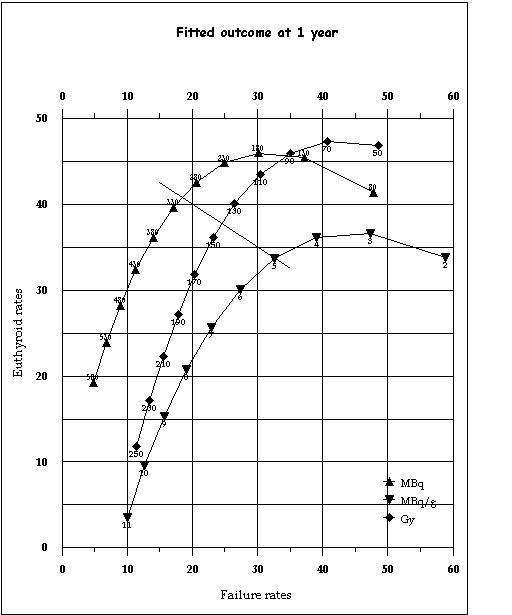
Figure 1.

The final model demonstrating the relationship between euthyroid rates at 1 year and failure rates (of treatment) at 1 year at various dose levels for the three methods of dose selection. This relationship is derived from the logarithmic cure-dose and linear hypothyroid-dose models described in the text where: Euthyroid rate = Cure – hypothyroidism rate Failure rate = 100 – cure rate The slanted line demarcates the level below which cure rates are predominantly due to hypothyroidism and vice-versa and serves as the upper limit for non-ablative dosing.
