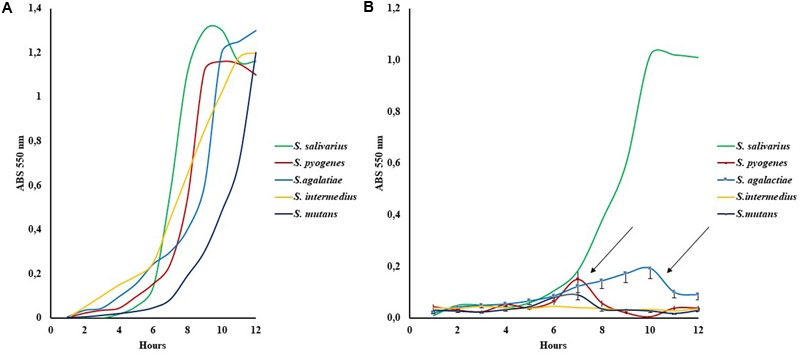
FIGURE 2.

Growth curves of five indicative Streptococcus strains in Schaedler broth (A) and with Schaedler broth LBO 50% (B). The arrows show the bell curves observed in Group II susceptibility strains (S. pyogenes, S. mutans, S. agalactiae), SD % ranged from 15 to 20% of the mean value.
