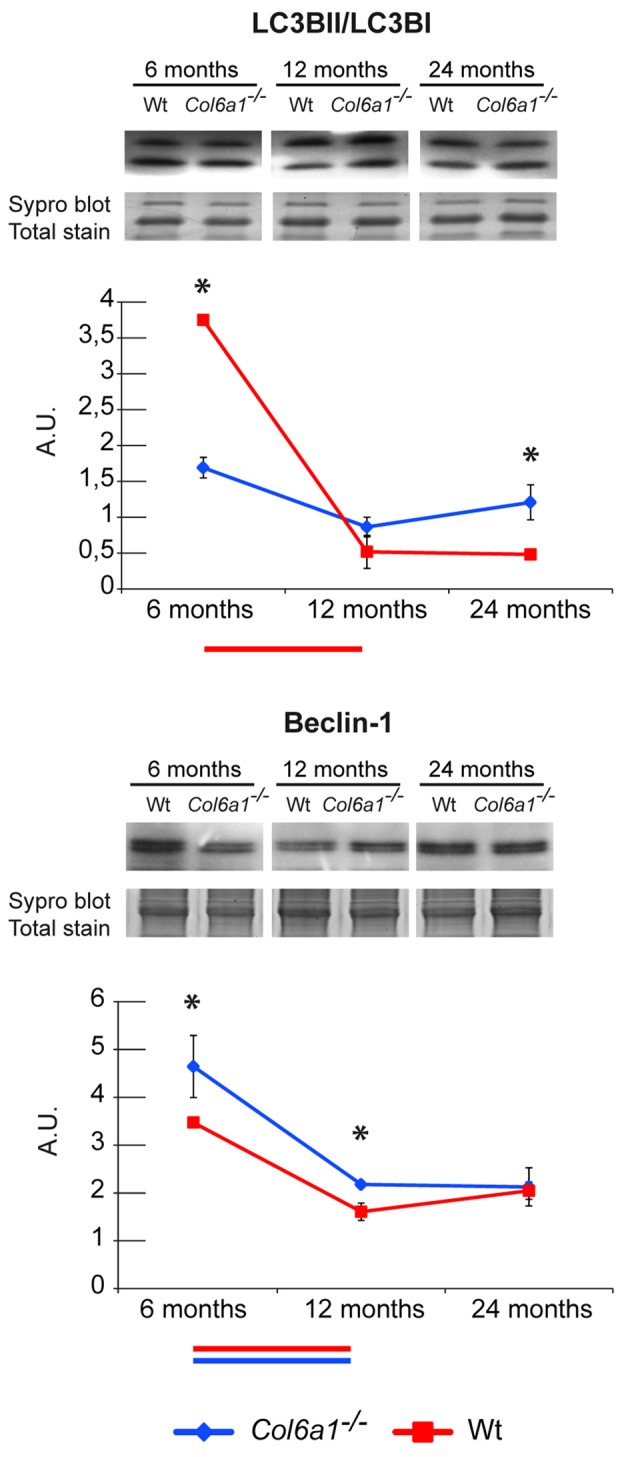
Figure 6.

Representative line charts and immunoblotting images of microtubule-associated proteins 1A/1B light chain 3 B (LC3B) and Beclin-1 in 6-, 12- and 24-month-old Col6a1−/− (blue line) and wt (red line) diaphragm. Blot images have been spliced for a better visualization, full-length images are available in supplementary material (Supplementary Figures S1D,F). Variations are expressed as band intensities (arbitrary units). The asterisks mark significant differences in Col6a1−/− mice compared to the respective age-matched Wt mice (Student’s t-test; n = 2; *p < 0.05). Bars below the charts represent significant differences (ANOVA and Tukey; n = 2; p < 0.05) between timepoints in Wt (red) and Col6a1−/− (blue) mice.
