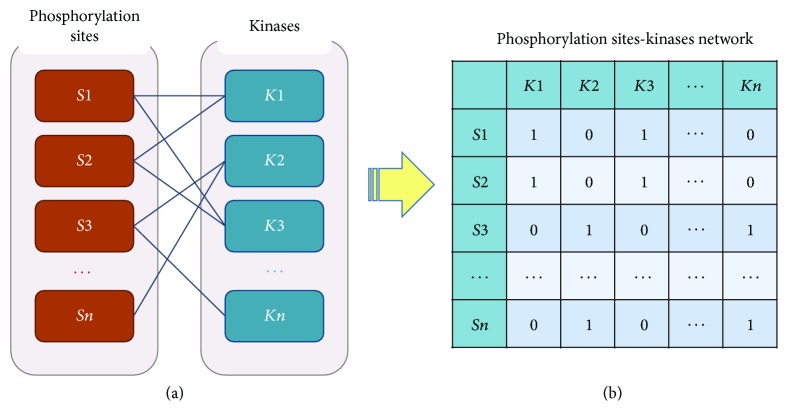
Figure 1.
Construction of phosphorylation site-kinase network and extracting the pSKN profiles. The bipartite network represents the relationships between the phosphorylation sites and kinases; the orange and blue nodes represent phosphorylation sites and kinases, respectively. The matrix represents the pSKN profiles that are extracted from the bipartite network; each row is phosphorylation site si and each column is kinase kj; if si is catalyzed by kj, the value is 1, otherwise 0.

