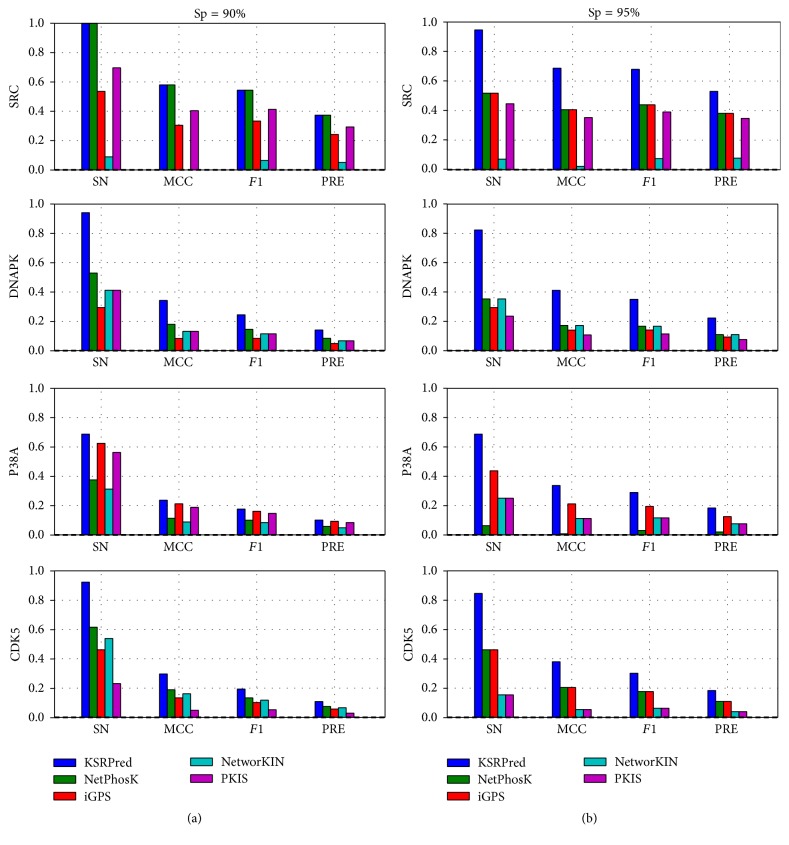
Figure 4.
Compare the Sn, MCC, F1, and Pre values of different methods on the independent dataset. (a) represents the performance at specificity of 90.0%, and (b) represents the performance at specificity of 95.0%. The horizontal axis represents sensitivity, Matthew correlation coefficient, F1-measure, and precision, respectively.

