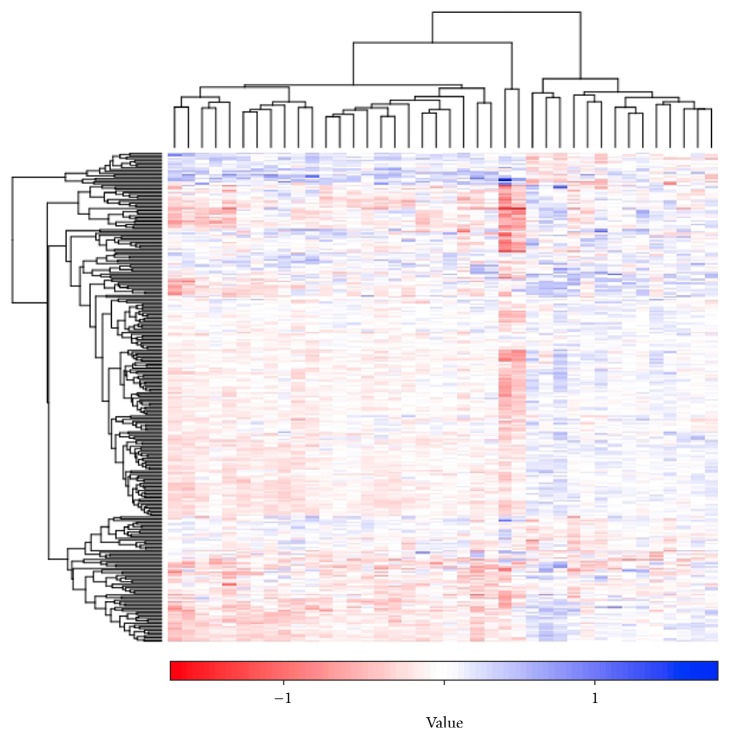
Figure 2.
Cluster analysis of using average Z approach as the iPAS on the dataset of postmenopausal osteoporosis (PMOP) through Gitools method. Pathways (n = 279) and samples are clustered based on iPAS. The color scale represents the relative levels of pathway aberrance. Horizontal axis is samples; vertical coordinate is differential pathways. iPAS means individual pathway aberrance score.

