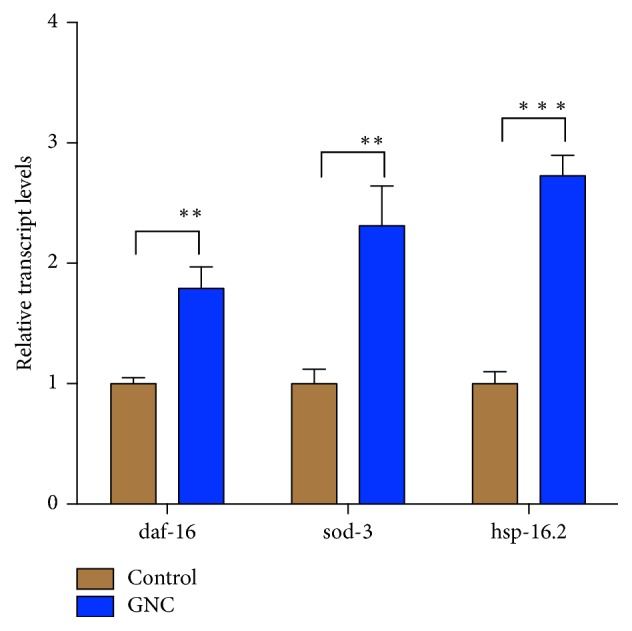
Figure 4.

Quantification of mRNA expression levels in GNC-treated worms. The GNC (3.94 mg/mL) treatment affected the relative levels of the daf-16, sod-3, and hsp-16.2 transcripts. β-Actin (act-4) was used as an endogenous control, and the expression levels were determined by qRT-PCR using the 2−ΔΔCT method. The data are displayed as means ± SD. ∗∗p ≤ 0.01; ∗∗∗p ≤ 0.001.
