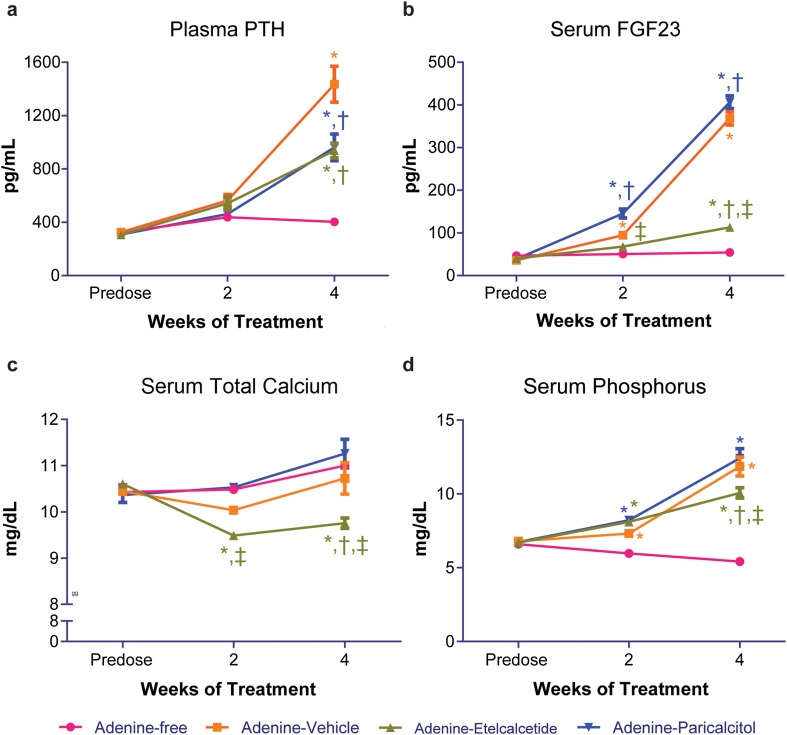
Fig. 2.
Plasma PTH, serum FGF23, total calcium, and phosphorus before and after treatment in rats on adenine or adenine-free diet. a Plasma PTH concentration. b Serum FGF23. c Serum total calcium concentration. d Serum phosphorus concentration. Data are expressed as mean ± SEM for 24 rats per group. PTH, parathyroid hormone; SEM, standard error of the mean. *P < 0.05 compared with the rats on adenine-free diet; † P < 0.05 compared with adenine-vehicle group; ‡ P < 0.05 compared with adenine-paricalcitol group

