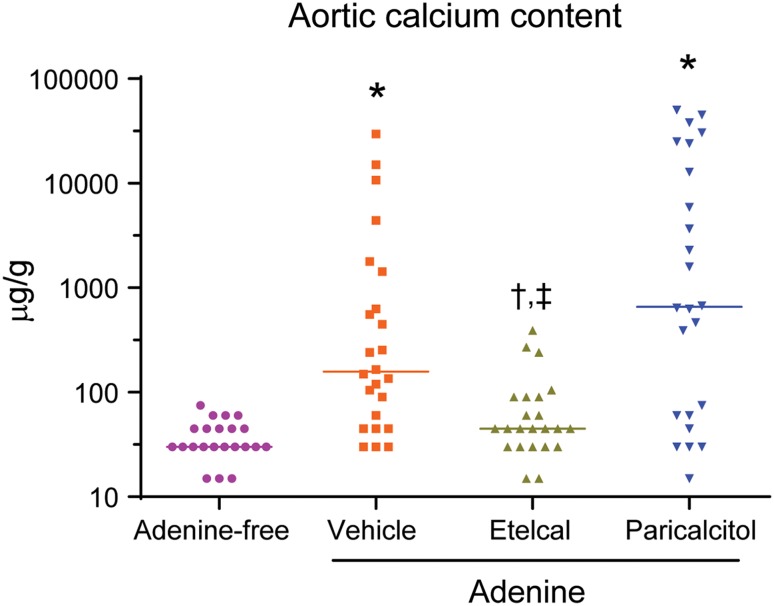
Fig. 5.
Aortic calcium content. Data represent individual rats with median value, with n = 23–24 per group. Etelcal, etelcalcetide. *P < 0.05 compared with the rats on adenine-free diet; † P < 0.05 compared with adenine-vehicle group; ‡ P < 0.05 compared with adenine-paricalcitol group. Y-axis was log-scaled for better visualization of individual rat with lower calcium profile

