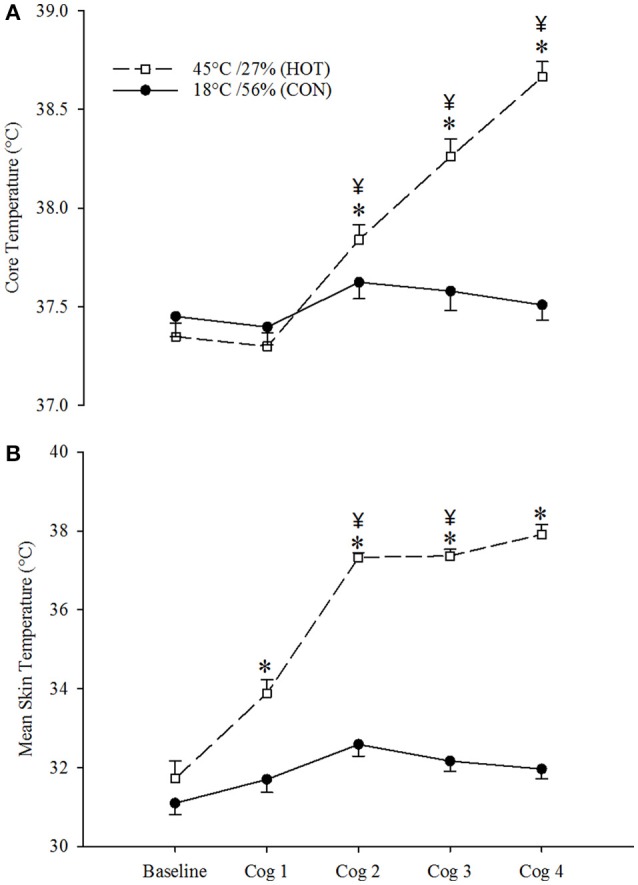
Figure 1.

Average core (A) and skin (B) temperatures at each cognitive testing time point during the CON (open circles) and HOT (closed circles) conditions. Data are mean ± SEM. *indicates different from CON (p < 0.001). ¥indicates different from Baseline within-condition for HOT (p < 0.0001) and CON (p < 0.01).
