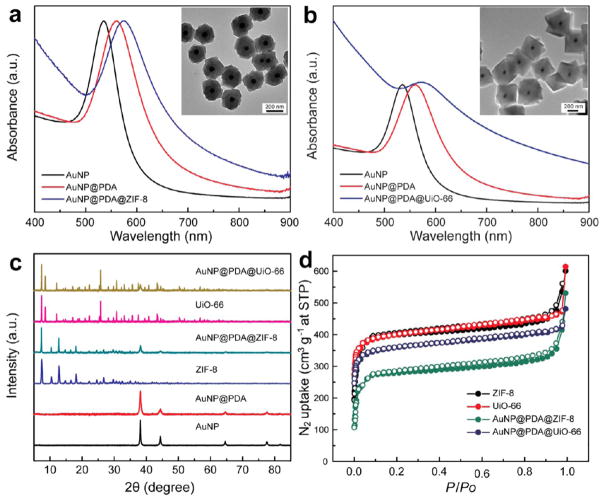
Figure 2.
(a) UV–vis spectra of Au nanoparticle, AuNP@PDA, and AuNP@PDA@ZIF-8. Inset: TEM image of AuNP@PDA@ZIF-8. (b) UV–vis spectra of Au nanoparticle, AuNP@PDA, and AuNP@PDA@UiO-66. Inset: TEM image of AuNP@PDA@UiO-66. (c) XRD patterns of different samples. (d) Nitrogen-sorption isotherms for different samples at 77 K up to 1 bar. The solid and open symbols represent adsorption and desorption, respectively.

