
Figure 8. Analysis of E. amylovora culturable and VBNC cell populations during a long-term starvation period (122 days) at 28 °C (A), 14 °C (B) and 4 °C (C).
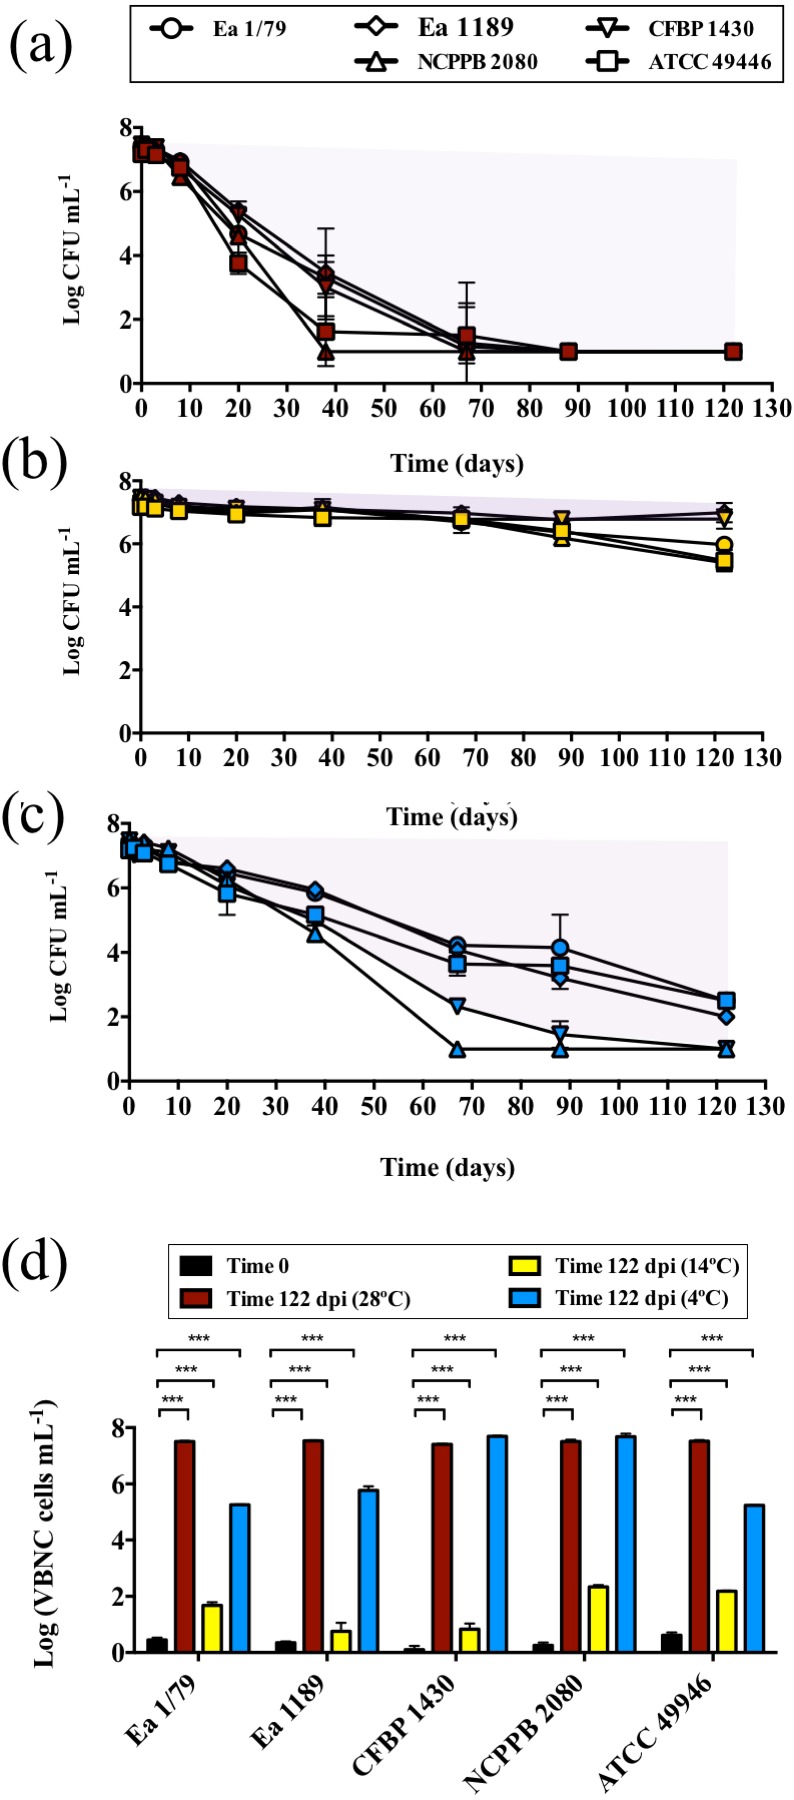
Culturable cell counts are represented with symbols (A–C). Purple areas indicating VBNC cell subpopulations are drawn (A–C). Given the similar trends in the VBNC induction of all the assayed E. amylovora strains, only results corresponding to strain CFBP 1430 are shown. VBNC cell populations at times 0 and 122 dpi are summarized in (D). Vertical lines indicate the SD, and asterisks denote statistically significant differences between temperatures (***, p < 0.001). These data are representative of an assay performed with three microcosms per strain and temperature, inoculated in independent experiments.