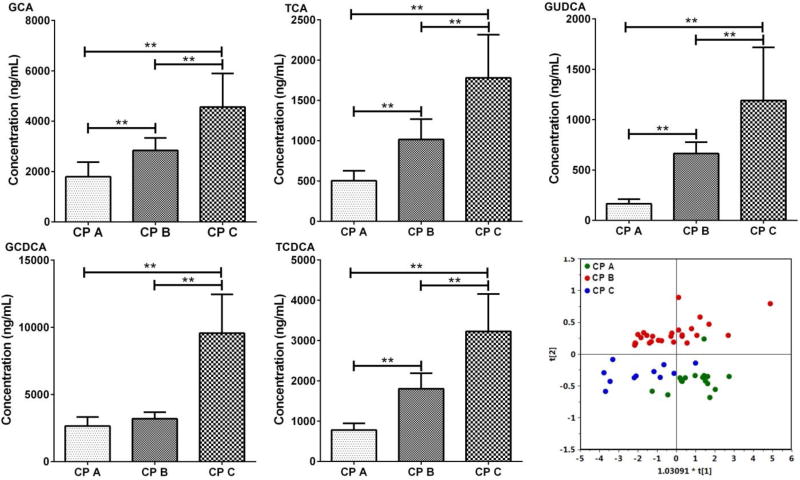
Figure 3.
Bar charts of five bile acids (ng/mL, mean ± SEM) that are differentially expressed among Child-Pugh A, B and C cirrhotic patients in the validation set, ** p<0.01 from a Student’s t test. OPLS-DA scores plot of bile acids in Child-Pugh class A, B and C of hepatic cirrhotic patients in the validation set.

