Figure 1.
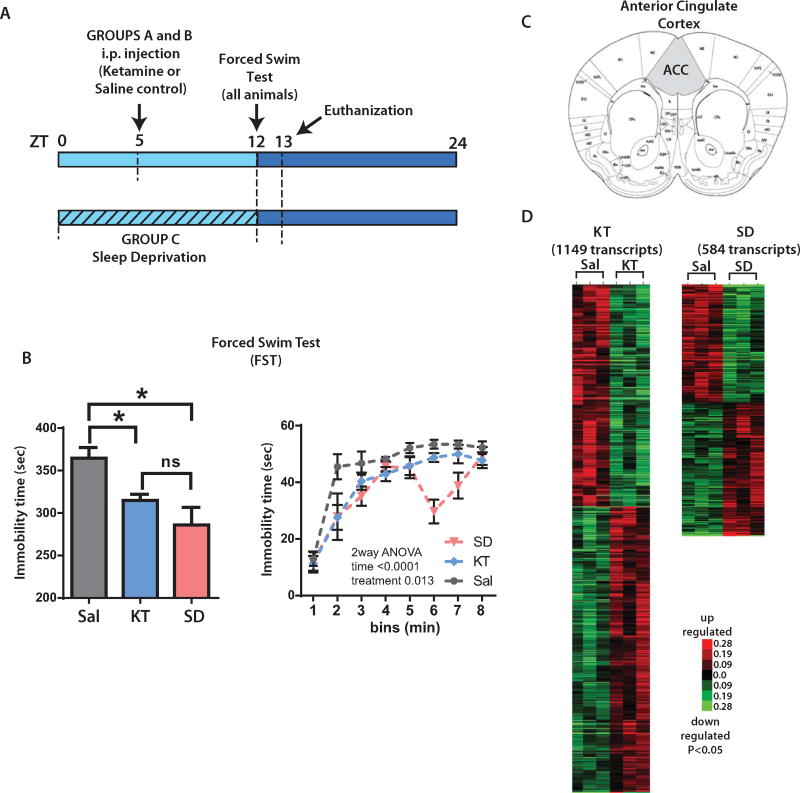
Transcriptional profile of ketamine (KT) and sleep deprivation (SD) interventions. (A) Mice were divided into three groups and were administered either KT (3 mg/kg intraperitoneally [i.p.] at zeitgeber time [ZT] 5) (group A) or saline ([Sal], 100 µL/0.03 kg i.p.) at ZT 5 (group B, which is the control) or underwent SD (animals were kept awake from ZT 0 to ZT 12) (group C). All treatment groups were assessed for antidepressant activity on the forced swim test (FST) starting at ZT 12. At ZT 13, animals were euthanized and brains were dissected. (B) (Left) The bar graph depicts differences in immobility times in KT- and SD-treated mice versus saline (control mice) on the FST (*p < .05, t test). Differences between SD and KT immobility times were non-significant (ns). (Right) Graph indicates the expression of immobility in 1-minute bins, (two-way analysis of variance [ANOVA], followed by Bonferroni’s post hoc test, n = 4 per group). (C) Coronal section of the anterior cingulate cortex (ACC) (analogous to the human anterior cingulate cortex) was microdissected for gene expression analyses (shaded area). (D) Heat map plots showing transcriptionally altered genes in KT or SD mice depicting significant differences on gene expression (p < .05). Red indicates upregulated transcripts; green indicates downregulated transcripts (p < .05, t test, KT or SD compared with control mice; n = 3 per group).

