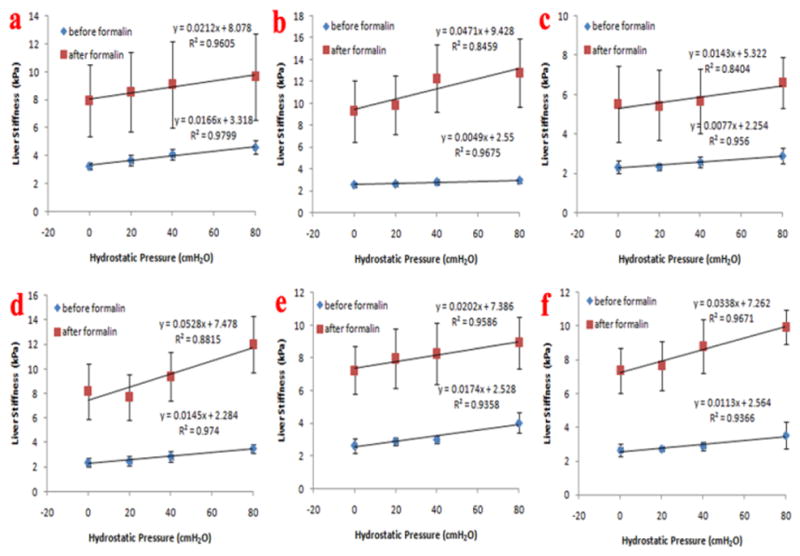
Fig. 3.

Fig. 3 shows the linear regression analysis for all six livers. The liver stiffness increased after the formalin treatment. The liver stiffness correlated very well with portal pressure for each liver (R>0.8). The linear regression analysis results show that the slope of the fits was larger for the formalin-treated livers than for the untreated livers.
