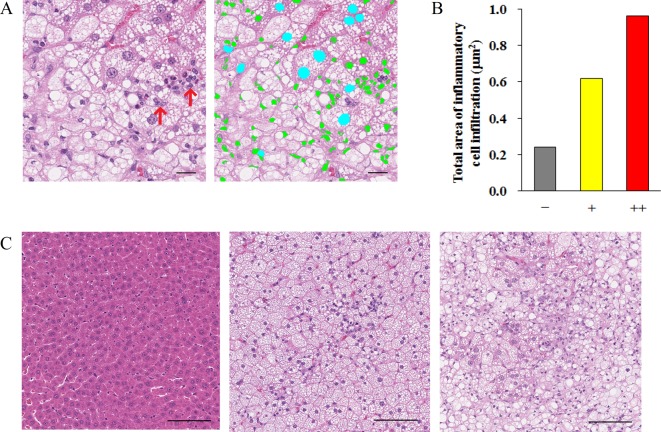
Fig. 3.
Analysis of infiltrating cells (lymphocytes) using Image-Pro Plus. (A) Left image: original image of tissue specimen. Right image: analyzed image of infiltration cells. Green-colored objects were infiltrating cells, which were recognized using a size limitation of 5–45 μm2. The area of infiltrating cells was measured. Light blue-colored objects represent nuclei. By adding measurement conditions with fill holes, area inside the contour of a nucleus was filled, and the nucleus was recognized as one object, whose size was larger than 45 μm2. Clustered infiltrating cells (red arrows) had sizes larger than 45 μm2, so they were not recognized as infiltrating cells in this experiment. Bar = 20 μm. (B) Total area of infiltrating cells in the liver tissue with various grades of inflammatory cell infiltration. For analysis, JPEG images of 4 mm2 areas at 5 points were extracted from the whole slide image. (C) Representative images of various grades (left, center, and right images: normal, −; slight, +; and moderate, ++, respectively) of cell infiltration. Bar = 100 μm.

