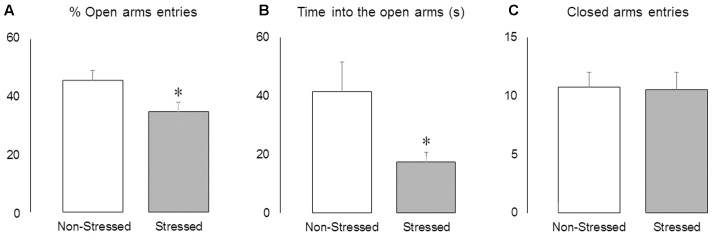
FIGURE 4.
Activity in the elevated plus-maze. (A) Percentage of open arms entries, (B) time spent into the open arms (s) and (C) frequency of closed arms entries in non-stressed controls and socially defeated mice 8 days after the last confrontation. Data are mean ± SEM. ∗versus non-stressed controls. p < 0.05, n = 12 mice per group.

