
FIGURE 4.
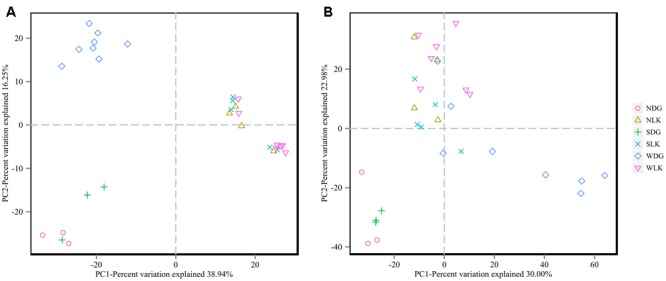
The beta diversity of the gut microbial composition. Principal coordinate analysis (PCoA) was conducted based on unweighted (A) and weighted (B) UniFrac distance matrices. The variation explained by the plotted principal coordinates is indicated in the axis labels.