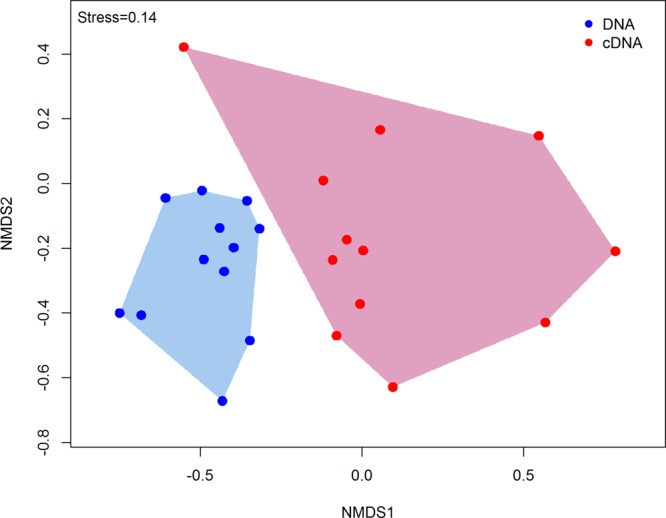
FIGURE 1.

Non-metric multidimensional scaling (nMDS) ordination plot (Bray–Curtis dissimilarities) comparing the structures of total and potentially active hypolith communities. Each point within the ordination represents an entire microbial community (sample). Total hypolith communities are shown as blue circles while potentially active communities are indicated by red circles. Different shaded areas depict different bacterial communities (PERMANOVA, P < 0.05).
