FIGURE 3.

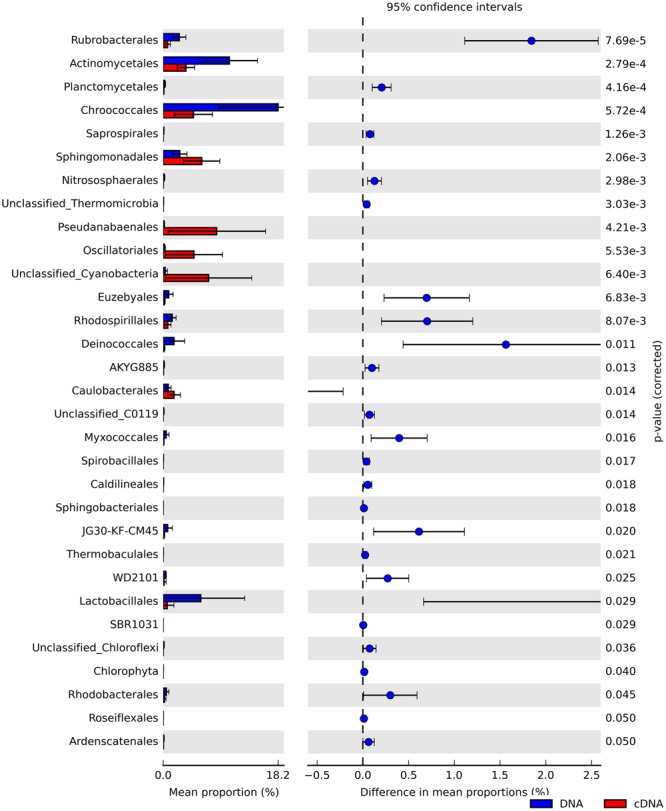
Extended bar charts showing significant differences in the relative abundances of taxa at the order level between the total (DNA, blue) and potentially active (RNA, red) hypolithic communities.

Extended bar charts showing significant differences in the relative abundances of taxa at the order level between the total (DNA, blue) and potentially active (RNA, red) hypolithic communities.