
Figure 7.
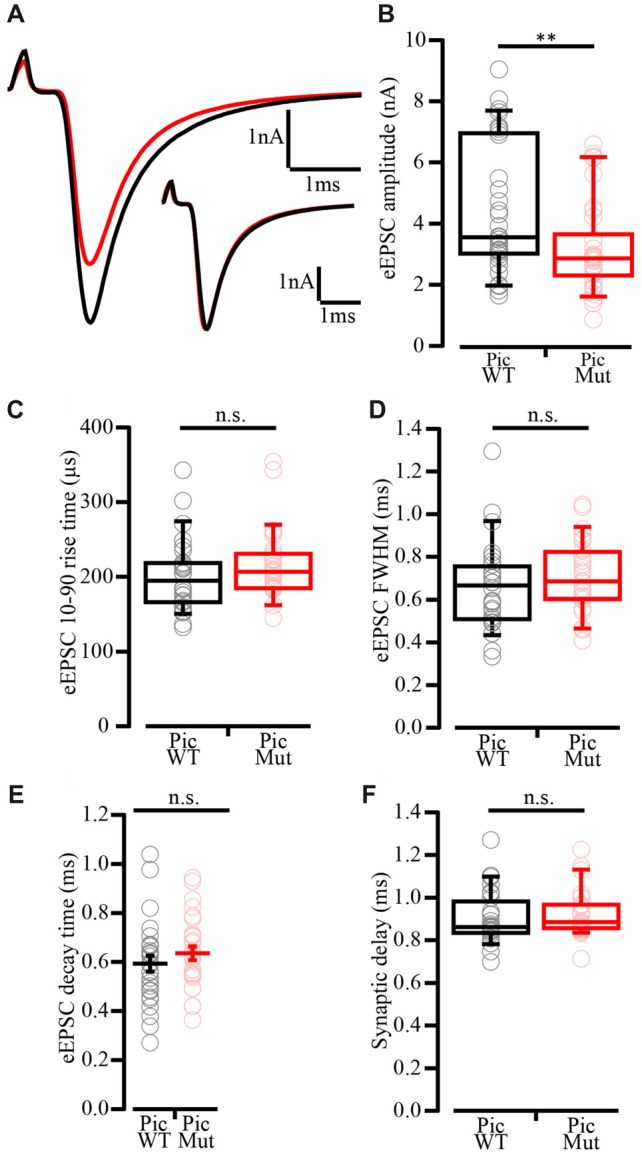
Reduced evoked EPSC amplitude in Piccolo-deficient endbulb of Held synapses. (A) Average traces of evoked EPSC (eEPSC) in PicWT (black) and PicMut (red) showing reduced eEPSC amplitude in the mutant. Inset: Average PicMut eEPSC trace scaled to the peak of the average wildtype trace demonstrating unaltered eEPSC kinetics in the mutant. Positive peak at onset of trace reflects the stimulation artifact. (B) Reduced eEPSC amplitude in PicMut (N = 19; n = 34) as compared to PicWT (N = 21; n = 33). Each data point represents the mean estimate of a given BC, box and whisker plots present grand median (of the means of all BCs), lower/upper quartiles, 10–90th percentiles). **p-value < 0.01, Wilcoxon rank sum test. (C–F) eEPSC kinetics: rise time (C), full-width at half-maximum (FWHM; D) and decay time (E), and synaptic delay (F) were not significantly altered between the two genotypes. Non-normally distributed data presented as box and whisker plots (grand median (of the means of all BCs), lower/upper quartiles, 10–90th percentiles; (C,D,F) n.s. —p-value ≥ 0.05, Wilcoxon rank sum test). Normally distributed data presented as mean (grand average of the means of all BCs) ± SEM (E; n.s.—p-value ≥ 0.05, Student’s t-test). PicWT N = 19; n = 28, PicMut N = 19; n = 28 (N, number of animals; n, number of BCs).