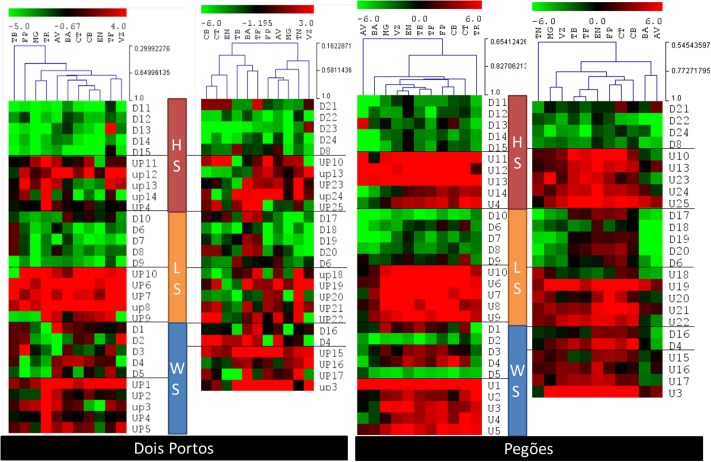
FIGURE 6.
Relative gene expression ratios obtained by RT-qPCR of the 65 DEGs quantified in the twelve varieties in both locations (Dois Portos and Pegões). Relative expressions in relation to control plants of TR (left) and TN (right) were calculated and values were normalized with respect to translation initiation factor eIF-3 subunit 4 (TIF), translation initiation factor eIF-2B alpha subunit (TIF-GTP) and actin 2 (act) mRNA. The data correspond to log2(gene expression ratio) of three independent samples measured in duplicate.

