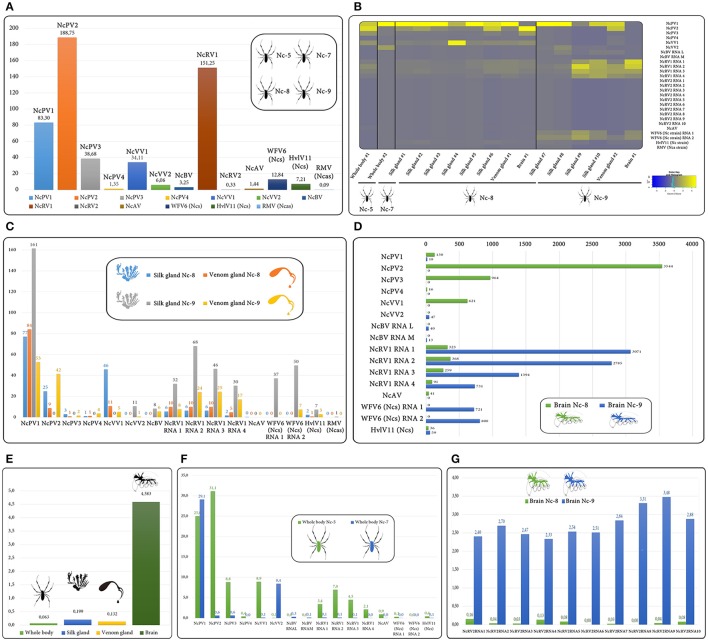
Figure 6.
Graphs bars and heatmap describing virus RNA transcript levels assayed in two whole body spider samples,10 individual silk glands, two venom glands, and two brain isolates collected from four females, Nep-5, Nep-7, Nep-8 and Nep-009. Values are expressed as FPKM, where M indicates million of non-rRNA host transcriptome reads that map to the host genome assembly NepCla1.0 in (B–D,F,G) and as total virus derived million nt in (A), or non-rRNA host transcriptome percentage reads that map to viruses in (E). FPKM Values corresponding to each sample are available as Supplementary Table 12.

