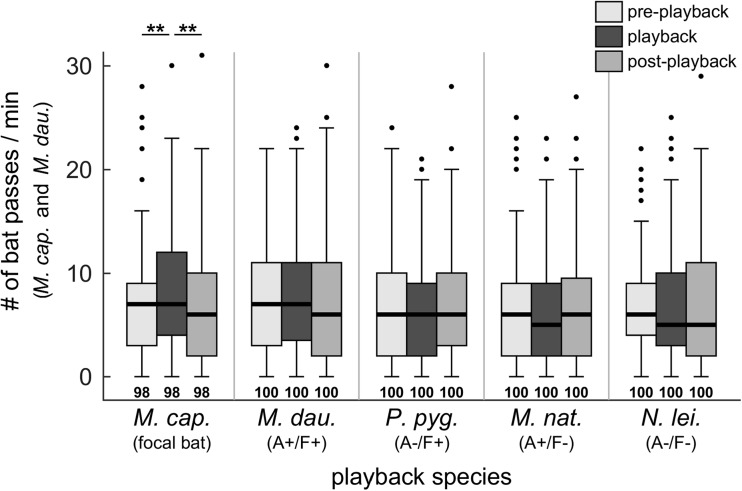
Fig. 4.
Group activity of M. capaccinii and M. daubentonii in the field measured as number of passes, as a function of playback species and experimental phase (Exp. 2). Echolocation call sequences of five different playback species were presented during the playback phase. Box plots present median, quartiles, whiskers at up to 1.5 times the interquartile range beyond the quartiles, and outliers. Asterisks indicate significant differences between experimental phases (Tukey post hoc test). A+/− and F+/− indicate our classification as similar/dissimilar in acoustic call structure (A) and foraging ecology (F) to the focal species

