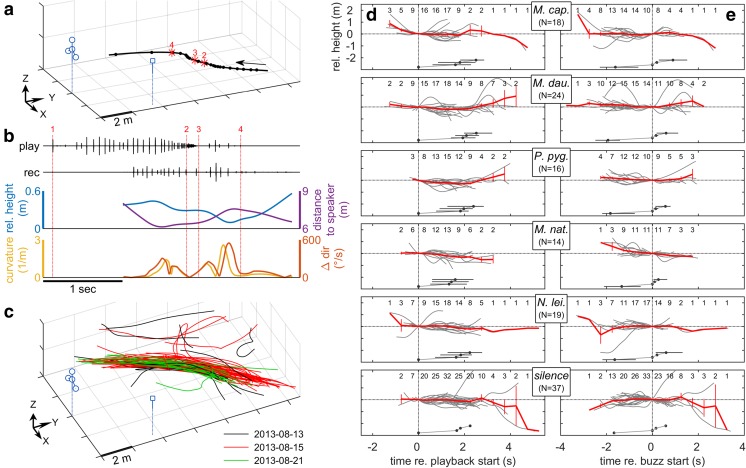
Fig. 5.
Trajectories and flight height of M. capaccinii and M. daubentonii in the field (Exp. 3). a Exemplary flight trajectory of one bat in response to M. daubentonii playback. Arrow shows flight direction; dots indicate bat positions at call emission; asterisks indicate bat positions at exemplary reception times of the playback (start/end of playback/buzz). Microphone array and playback loudspeaker are shown in blue, with solid lines indicating their tripods and dotted lines visualising their position on the XY-plane. b M. daubentonii playback, call recording and four trajectory parameters of the trajectory shown in a. Vertical dotted lines mark the start/end of the playback sequence and the feeding buzz, respectively; small numbers correspond to the numbers in a. If bats showed a goal-directed approach towards the playback, we expected to see increased flight height (since the loudspeaker was positioned above the bats), reduced distance to the speaker and larger curvature and changes in flight direction. c Flight trajectories (N = 80) recorded over three nights (colour-coded) at one river foraging site. d + e Relative trajectory height (N = 128) as a function of playback species and time relative to the playback, with t = 0 set as the start of the playback (d) and start of the buzz (e), respectively. Lines are individual data (grey) and means ± SEM binned per 0.5 s (red). Small numbers at the top indicate number of trajectories per bin. Dots with horizontal bars below the data indicate the mean playback time and the min/max-range across all playbacks for the four reference times indicated by numbers 1–4 in a and b: start/end of the total playback sequence and of the feeding buzz

