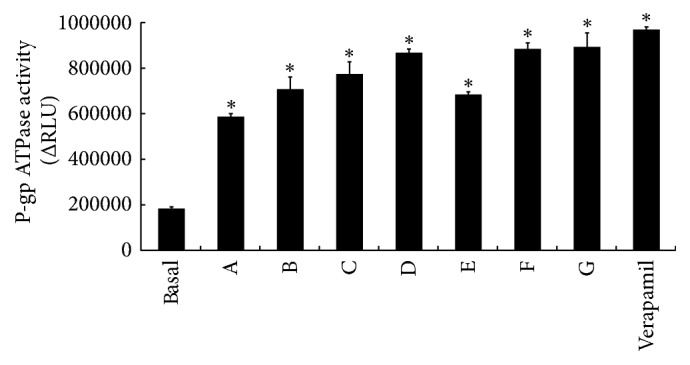
Figure 5.

Effect of RPAE and/or SSE on P-gp ATPase activity (n = 3). In the figure, A is the SSE (1 μg/mL) group, B is the SSE (1 μg/mL) + RPAE (1 μg/mL) group, C is the SSE (1 μg/mL) + RPAE (3 μg/mL) group, D is the SSE (1 μg/mL) + RPAE (6 μg/mL) group, E is the RPAE (1 μg/mL) group, F is the RPAE (3 μg/mL) group, and G is the RPAE (6 μg/mL) group. ∗P < 0.05 versus the control group.
